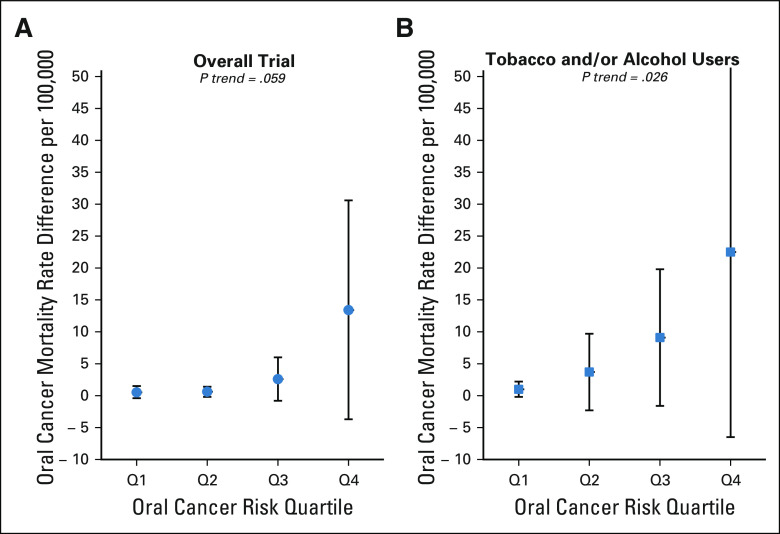
FIG 2.
Oral cancer mortality RD (screening v control arms) across oral cancer risk in the Kerala Oral Cancer Screening Trial. Shown are adjusted oral cancer mortality RDs between the screening and control arm participants in the overall trial participants (A) and among ever-tobacco and/or ever-alcohol users (B). Estimates (circles and squares) and 95% jackknife CIs (error bars) are shown across oral cancer risk prediction model–based quartiles (defined on the basis of the control population). P values shown are for trend across quartiles. See statistical methods for additional details. RD, rate difference.

