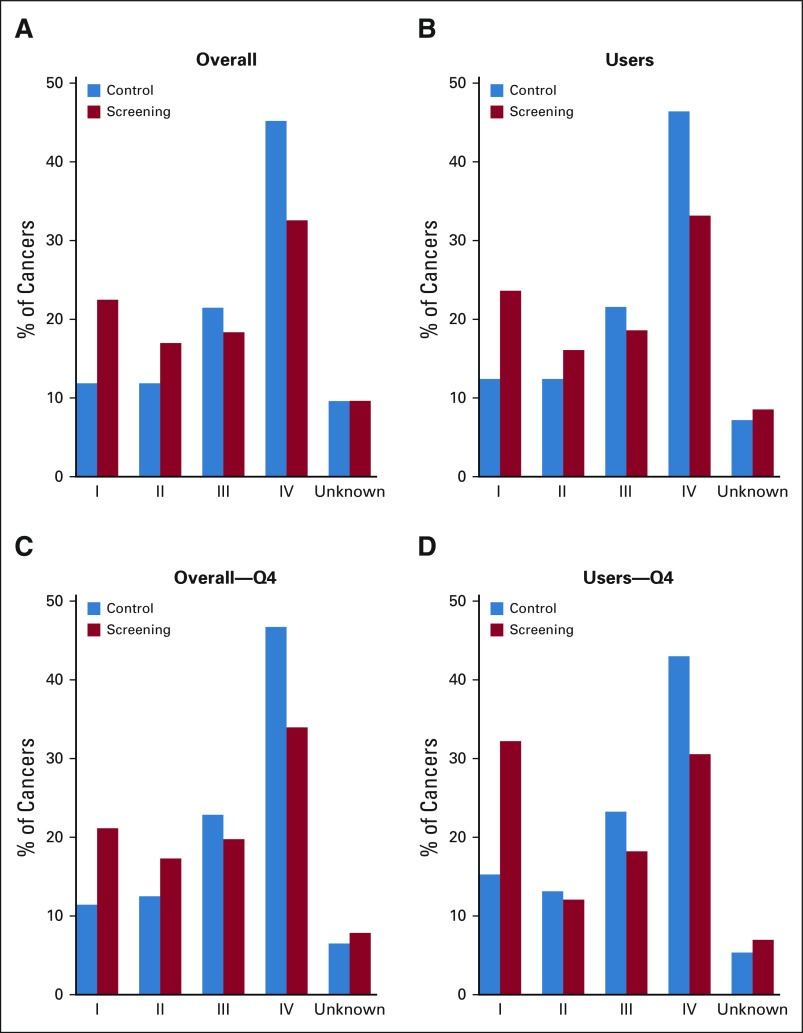
FIG 3.
Stage distribution of oral cancers detected in the screening and control arms. The figure depicts the percentage of oral cancers detected at stages I, II, III, and IV and with unknown staging in the screening and control arms in the overall trial population (A) and restricted to ever-tobacco and/or ever-alcohol users (B), the highest risk quartile in the overall trial (C), and the highest risk quartile among ever-tobacco and/or ever-alcohol users (D). Chi-square test P = .0059, P = .013, P = .019, and P = .022 for A, B, C, and D, respectively.

