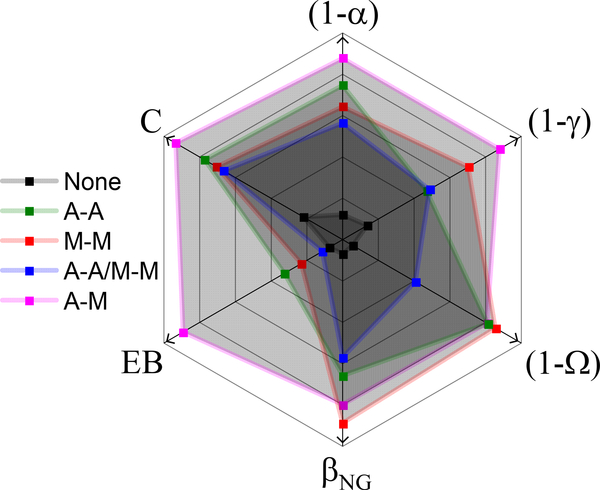
Figure 6. Multiple transport metrics highlight the degree to which crosslinking motif drives deviations from normal Brownian motion in composite cytoskeleton networks.
Using the same color scheme as in previous figures, we show how the type of crosslinking, or lack thereof (black), influences subdiffusion (), spatiotemporal heterogeneity (), and ergodicity () across complementary, independent measurement techniques (SPT, DDM). A greater distance from the center (in the direction of the arrows) represents a greater deviation from normal Brownian diffusion. Each metric is scaled separately.

