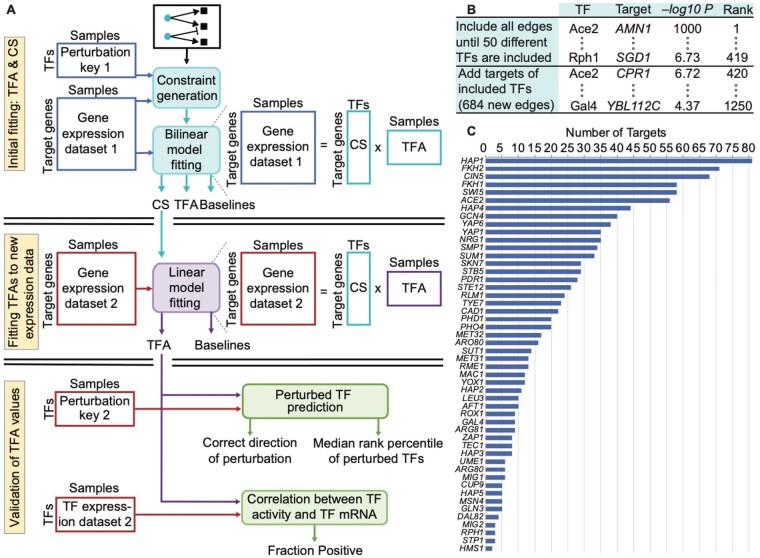
Fig. 1.
Evaluation framework and ChIP-based network construction. (A) Overview of three-stage model fitting and TFA evaluation procedure. Gene expression levels and the perturbation key from dataset 1 are used only in the initial fitting. The CSs inferred in the initial fitting are fixed while the TFAs and baselines are refit to the target gene expression levels from dataset 2. The mRNA levels of the TFs and the perturbation key from dataset 2 are used only for evaluation. (B) Illustration of how edges were selected for the ChIP-based network. All edges were ranked according to their −log P-value for the TF binding in the promoter of the target. Edges were selected in rank order until there was at least one edge from 50 different TFs. Lower-ranked edges were then selected for those TFs until rank 1,250. After initial model construction, we removed any TFs with a single target and any set of TFs with identical targets, along with those targets. We then returned to the list and iteratively added edges that had previously been passed over until the network stabilized at 50 TFs. This yielded a network with 1,104 edges. (C) The number of targets for each of the 50 different TFs in the ChIP network.

