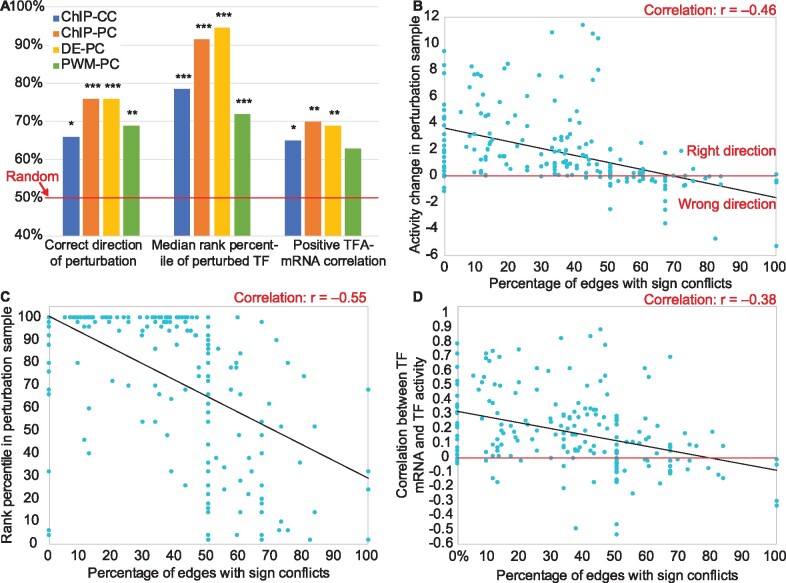
Fig. 2.
Determinants of TFA inference accuracy. (A) Effects of network construction and constraint generation on TFA accuracy. Blue: ChIP network with correlation-based constraints. Orange: ChIP network with perturbation-based constraints. Yellow: Differential expression network with perturbation-based constraints. Green: Binding-specificity (PWM) network with perturbation-based constraints. Asterisks above the bars indicate magnitude of significance compared to a random model, with 1, 2 or 3 asterisks representing P-value thresholds of 0.01, 0.001 or 0.0001. (B) Vertical axis: The activity of each TF in the sample in which it was perturbed minus its activity in the unperturbed sample, oriented so that higher is better. TFs plotted below the horizontal axis have been inferred to change activity in the wrong direction. Horizontal axis: The fraction of each TF’s targets for which the TFKO and ZEV datasets suggest conflicting CS signs. TFs with <50% conflict edges are almost all predicted in the correct direction, while most TFs with >50% conflict edges are not. (C) Vertical axis: Rank percentile of the perturbed TF’s activity change in each perturbation sample (higher is better). Horizontal axis: Same as (B). TFs with a higher percentage of conflict edges tend to be ranked lower. (D) Vertical axis: median fraction of bootstrap samples in which a TF’s mRNA level and its inferred activity level are positively correlated (see main text). TFs with a higher percentage of conflicting edges tend to have low or negative correlation. (B–D) Results from the 50-TF ChIP-PC and DE-PC networks, trained on each of the datasets and tested on the other, have been combined, but each individual set of 50 points showed similar, highly significant correlations

