Fig. 4.
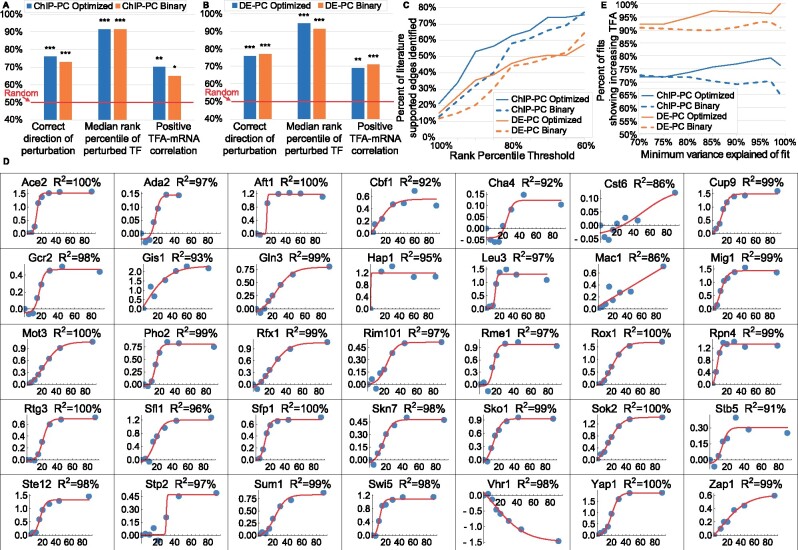
Impact of using a CS matrix optimized on a different dataset versus using a signed binary CS matrix. (A) ChIP-PC network. (B) DE-PC network. (C) Percent of literature-supported edges between TFA regulators and TFs identified, as a function of minimum rank percentile for identification. Solid lines: CS matrix optimized on the ZEV dataset and used to infer TFAs in the samples in which a TF regulator was deleted. Dashed lines: Signed binary CS matrix. For TFs whose change in standardized log activity from WT ranks above 85th percentile, more literature supported edges are identified by using optimized CS matrices than by using signed binary matrices. (D) Sigmoidal fits to log2 fold change of TFAs inferred for the ZEV time course data, using the DE-PC network and a CS matrix optimized on the TFKO dataset, relative to the 0 min timepoint. Only fits with variance explained above 85% are shown. In all but one of the 35 fits, TF activity is correctly inferred to be increasing (97%). Only Vhr1 activity is inferred to change in the wrong direction, probably because 9 of its 11 targets have sign conflict (80%, see Fig. 2B–D). (E) After fitting sigmoidal curves as in D and imposing various thresholds on the variance explained by the fit, the percentage of fits that correctly show increasing activity. The DE-PC network (orange lines) performs better than the ChIP-PC network (blue lines). For each network, using a CS matrix optimized on the TFKO data (solid lines) generally shows better performance than using a signed binary CS matrix (dashed lines), and this effect increases as the variance explained by the sigmoidal fits increases

