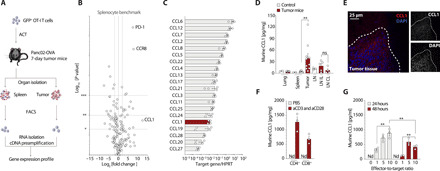
Fig. 1. CCR8 is used by a subset of transferred antigen-specific T cells to traffic to a murine pancreatic cancer in a CCL1-dependent manner.

(A) Schematic experimental layout to determine the gene expression profile of OT-I T cells after adoptive transfer. (B) Volcano plot for gene expression profile of tumor-infiltrating OT-I T cell compared to a splenocyte benchmark. Gene expression is depicted on the x axis versus the P value depicted on the y axis. (n = 3 mice). (C) RT-PCR gene analysis of explanted Panc02-OVA tumors (n = 4). HPRT, hypoxanthine-guanine phosphoribosyltransferase. (D) Enzyme-linked immunosorbent assay (ELISA) for murine CCL1 on organ lysates of control animals (n = 3) or Panc02-OVA tumor-bearing animals (n = 10). LNIL, lymph node ipsilateral to the tumor; LNCL, lymph node contralateral to the tumor. (E) Fourteen-day Panc02-OVA tumor explants, embedded in OCT medium and frozen for cryosectioning and stained with CCL1 and 4′,6-diamidino-2-phenylindole (DAPI) (representative of n = 3 mice). (F) ELISA for murine CCL1 on CD4+ or CD8+ magnetic-activated cell-sorted T cells after 24-hour stimulation with anti-CD3 and anti-CD28 antibodies or vehicle solutions only (representative of n = 3 independent experiments). (G) ELISA for murine CCL1 of supernatants generated upon 24- or 48-hour culture of different effector to target ratios, namely, 0, 1, 5, or 10 OT-I T cells to 1 tumor target cell (a constant number of 20.000 Panc02-OVA tumor cells was used) (representative of n = 3 independent experiments). nd stands for nondetectable. ns stands for nonsignificant P > 0.05. Experiments show mean values ± SEM of at least triplicates and are representative of at least three independent experiments. P values are based on two-sided unpaired t test. Data shown in (D) are pooled from three independent experiments.
