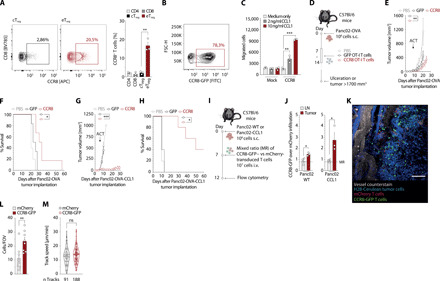
Fig. 2. CCR8 transduction in OT-I T cells improves ACT efficacy through CCL1-dependent tumor trafficking.

(A) CCR8 staining of live, CD45+CD3+CD4+FoxP3+ CD44high CD62L− eTreg and CD44low CD62L+ cTreg Panc02-OVA–infiltrating cells. CCR8 expression on CD4+, CD8+, eTreg, and cTreg T cells. (n = 3 mice). APC, Allophycocyanin. (B) CCR8-GFP transduction efficiency of murine T cells. FITC, fluorescein isothiocyanate. (C) In vitro migration of murine T cells to CCL1. (D) Experimental layout for (E) to (H). (E) Tumor growth curves of mice treated with a single intravenous (i.v.) injection of phosphate-buffered saline (PBS) or 107 GFP-transduced or CCR8-transduced OT-I T cells (n = 5 mice per group). (F) Tumor survival curves of (E). (G) Panc02-OVA-CCL1 tumor growth curves of mice treated with a single intravenous injection of PBS or 107 GFP-transduced or CCR8-transduced OT-I T cells (n = 5 mice per group). (H) Tumor survival curves of (G). (I) ACT tracking experiments in Panc02 or Panc02-CCL1 tumors by flow cytometry. s.c., subcutaneous. (J) Live, CD45.1+ tumor-infiltrating T cells (n = 3 mice). (K and L) ACT tracking in mice with tumors in a dorsal skinfold chamber to enable multiphoton intravital imaging (L) and speed quantification of tumor-infiltrating T cells (M) (n = 8 mice). FOV, field of view. Experiments show mean values ± SEM and are representative of three independent experiments, except (G) and (H) that are representative of two independent experiments. P values for (C), (J), (L), and (M) are based on a two-sided unpaired t test. Analyses of differences between groups for (E) and (G) were performed using two-way analysis of variance (ANOVA) with correction for multiple testing by the Bonferroni method. Comparison of survival rates for (F) and (H) was performed with the log-rank (Mantel-Cox) test.
