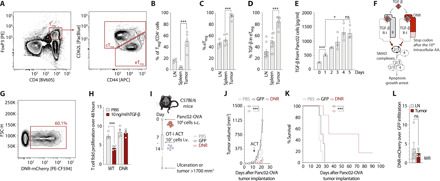
Fig. 3. DNR-transduced T cells retain proliferative capacity despite TGF-β.

(A) CD45+CD3+CD4+FoxP3+ CD44high CD62L− eTreg and CD44low CD62L+ cTreg Panc02-OVA infiltrating cells (n = 5 mice). PE, Phycoerythrin. (B) Percentage of Treg/CD4+ in (A) (n = 5 mice). Treg cells: lymph nodes 15406 ± 5351, spleen 6992 ± 9702, and tumor 893 ± 244 (mean absolute cells ± SD). (C) Percentage eTreg cells in Treg cells. (D) Percentage TGF-β+ cells in eTreg (n = 10). (E) Murine TGF-β ELISA on 20.000 tumor cells supernatant (n = 3). (F) DNR downstream signaling. AA, amino acid. (G) Transduction efficiency of murine T cells with DNR. (H) T cell proliferation measured through flow cytometry (n = 3). (I) Experimental layout for tumor challenge with Panc02-OVA. (J) Tumor growth curve in mice treated with a single intravenous injection of PBS or 107 GFP-transduced or DNR-transduced OT-I T cells (n = 5). (K) Tumor survival curves of (J). (L) Flow cytometry ACT tracking in Panc02 tumor–bearing mice treated with an equal mix of DNR-mCherry T cells and GFP T cells (n = 3). Experiments show mean values ± SEM and are representative of three independent experiments, except (A) to (C), which was performed for a total of 5 mice, and (D) a total of 10 mice. P values for (B), (C), (D), (E), and (L) are based on two-sided unpaired t test. Analyses of differences between groups for (J) were performed using two-way ANOVA with correction for multiple testing by the Bonferroni method. Comparison of survival rates for (K) was performed with the log-rank (Mantel-Cox) test.
