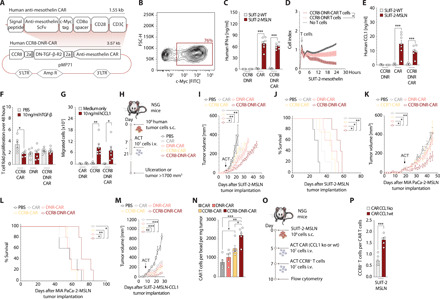
Fig. 5. CCR8-DNR-CAR T cells are effective in human tumor models.

(A) Schematic representation of construct. (B) Transduction efficiency of human T cells with CCR8-DNR-CAR. (C) Human IFN-γ ELISA on 24-hour coculture supernatants. (D) SUIT-2-MSLN killing measured by xCELLigence. (E) Human CCL1 ELISA on 24-hour coculture supernatants. (C to E) 10:1 effector to target cells. (F) Forty-eight–hour T cell expansion, flow cytometry. (G) In vitro migration of T cells to CCL1, flow cytometry. (H) Experimental layout for (I) to (M). Tumor growth and survival curves of SUIT-2-MSLN (I and J), MIA PaCa-2-MSLN (K and L), and SUIT-2-MSLN-CCL1 (M) treated with a single intravenous injection of PBS or 107 CAR-, DNR-CAR–, CCR8-CAR–, or CCR8-DNR-CAR–transduced T cells (n = 5 mice per group). (N) Flow cytometry quantification of CAR T cells per bead per milligram on day 27 after tumor implantation (n = 5 mice). (O) Experimental layout for (P). (P) SUIT-2-MSLN tumor–bearing mice were administered with 107 CAR T cells that were either wild-type (wt) or CCL1 knockout (ko). This was followed by a treatment with 107 CCR8-transduced T cells (n = 7 mice). Experiments show mean values ± SEM of n = 7 healthy donors for (B) to (G), one experiment for (I) to (L) and (P), and two independent experiments for (M) and (N). P values for (C), (E), (F), (G), (N), and (P) are based on a two-sided unpaired t test. (D), (I), (K), and (M) were assessed through two-way ANOVA with correction for multiple testing by the Bonferroni method. (J and L) Survival rate comparison through the log-rank (Mantel-Cox) test.
