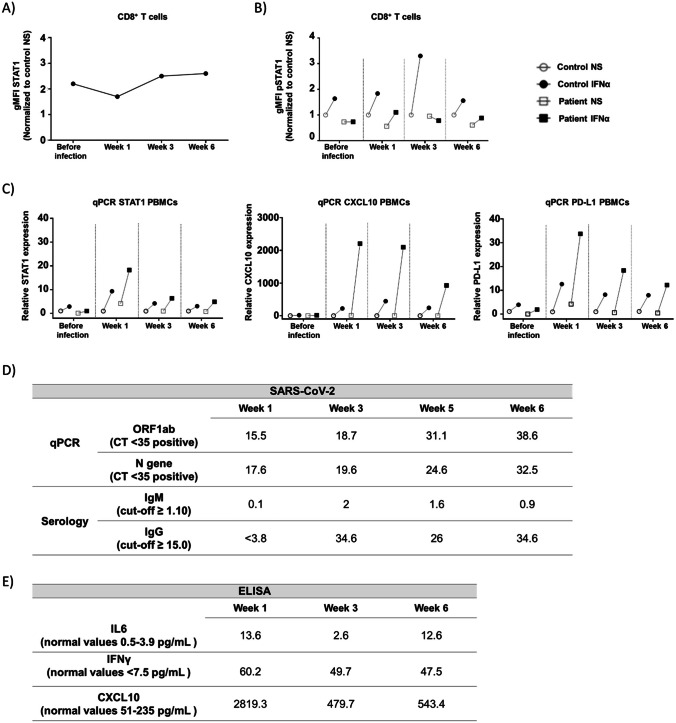
Fig. 1.
SARS-CoV-2 infection and impact of STAT1 pathway in the presence of ruxolitinib. Evaluation of the JAK/STAT1 pathway by flow cytometry (A, B) and qPCR (C). Non-stimulated STAT1 levels in CD8+ T cells before and during SARS-CoV-2 infection (A); pSTAT1 levels in CD8 + T cells pre- and post-stimulation with IFNα before and during SARS-CoV-2 infection (B). Expression of STAT1, CXCL10, and PD-L1 (from left to right) in PBMCs pre- and post-stimulation with IFNα before and during SARS-CoV-2 infection (C). Data from non-stimulated and stimulated samples represented as white and black symbols, respectively. Control and patient data represented as circles and squares, respectively. The presented data in A and B has been normalized to non-stimulated samples from healthy controls. PBMCs, peripheral blood mononuclear cells; NS, non-stimulated; IFNα, stimulated with IFNα; gMFI, geometric mean fluorescence intensity. Molecular/serological SARS-CoV-2 results during infection (D). CT, cycle threshold; ORF1ab, Open Reading Frame ab gene. ELISA determinations of IL-6, IFNγ, and CXCL10 serum levels during infection (E)

