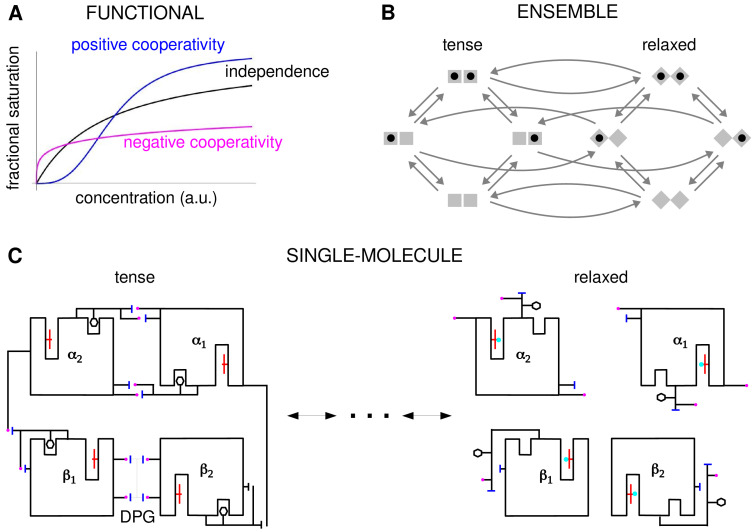
Figure 2. Cooperativity and allostery from three perspectives.
(A) Plots of the binding function, whose shape reflects the interactions between binding sites, as described in the text. (B) The Monod, Wyman and Changeux (MWC) model with a population of dimers in two quaternary conformations, with each monomer having one binding site and ligand binding shown by a solid black disc. The two monomers are considered to be distinguishable, leading to four microstates. Directed arrows show transitions between microstates. This picture anticipates the graph-theoretic representation used later in this paper. (C) Schematic of the end points of the allosteric pathway between the tense, fully deoxygenated and the relaxed, fully oxygenated conformations of a single haemoglobin tetramer, , showing the tertiary and quaternary changes, based on Figure 4 of Perutz, 1970. Haem group (red); oxygen (cyan disc); salt bridge (positive, magenta disc; negative, blue bar); DPG is 2–3-diphosphoglycerate.

