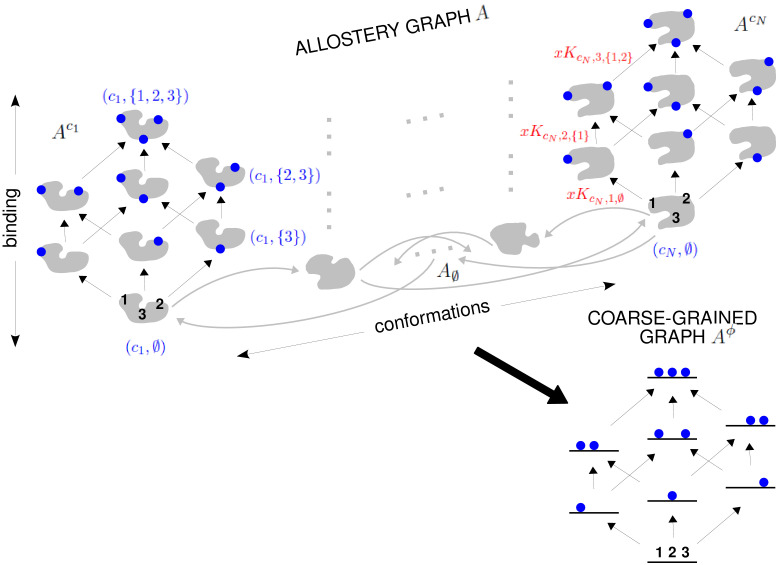
Figure 4. The allostery graph and coarse graining.
A hypothetical allostery graph (top) with three binding sites for a single ligand (blue discs) and conformations, , shown as distinct grey shapes. Binding edges (‘vertical’ in the text) are black and edges for conformational transitions (‘horizontal’) are grey. Similar binding and conformational edges occur at each vertex but are suppressed for clarity. Note that edges are shown in only one direction but are always reversible. All vertical subgraphs, , have the same structure, as seen for the vertical subgraphs, (left) and (right), and all horizontal subgraphs, , also have the same structure, shown schematically for the horizontal subgraph of empty conformation, , at the base. Example notation is given for vertices (blue font) and edge labels (red font), with denoting ligand concentration and sites numbered as shown for vertices and . The coarse-graining procedure coalesces each horizontal subgraph, , into a new vertex and yields the coarse-grained graph, (bottom right), which has the same structure as for any . Further details in the text and the Materials and methods.

