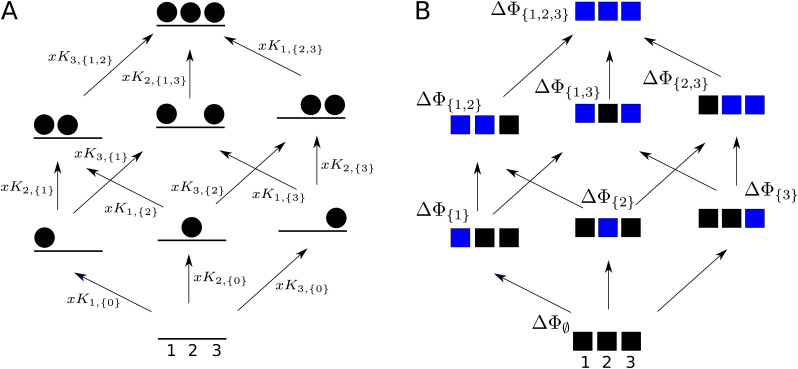
Figure 5. Graphs for defining higher-order measures.
(A) Equilibrium graph, similar to those in Figure 4, for binding of a ligand to three sites on a single conformation, ordered as shown at the base, and annotated with edge labels. The single conformation has been omitted from subscripts for clarity. (B) Directed graph used to define higher-order couplings, for a macromolecule with three sites or modules (solid squares), ordered as shown at the base, with perturbations indicated by blue colour in place of black. Vertices are annotated with the corresponding free energy.

