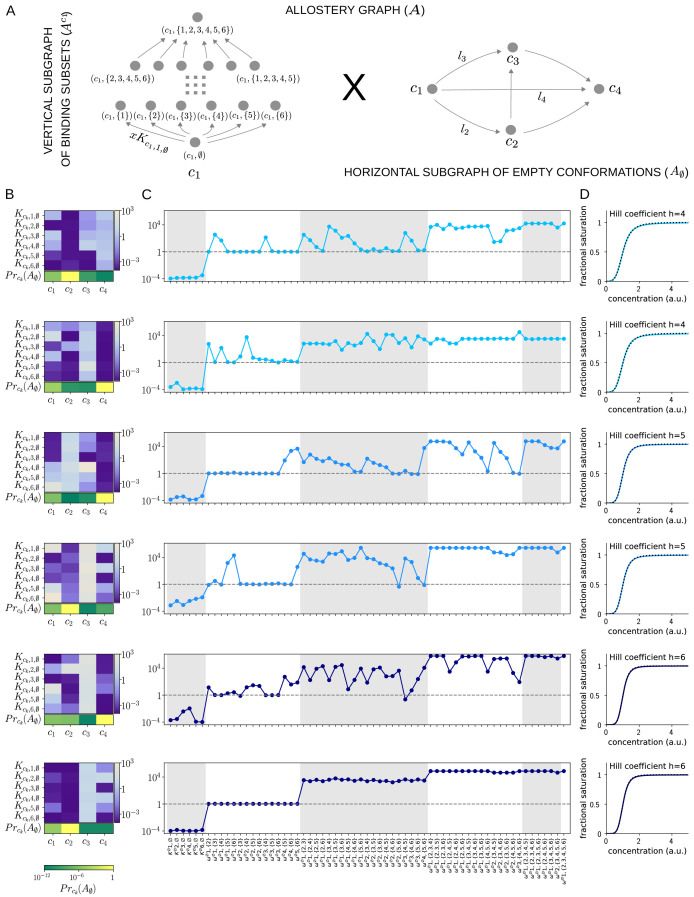
Figure 9. Allosteric ensembles for Hill functions.
(A) Allostery graph, , for representing Hill functions with six binding sites and four conformations, shown as the product of the vertical subgraph of binding subsets and the horizontal subgraph of empty conformations. Some vertices are annotated and some edges are labelled; the edge labels, and , on the horizontal subgraph are the independent labels coming from a spanning tree used in the algorithm described in the text. (B) Intrinsic bare association constants in each conformation, in arbitrary units of (concentration)−1 colour coded in the vertical bar on the right, and the probability distribution on the subgraph of empty conformations, colour coded in the horizontal bar at the bottom. (C) Corresponding effective association constants in arbitrary units of (concentration)−1 and the non-dimensional independent effective higher-order cooperativities arising from the ensemble. (D) Corresponding binding functions (blue curves) overlaid on the Hill function (black dashes) with the indicated Hill coefficient, . Two sets of parameter values are shown, with the same shade of blue, for each Hill coefficient , 5 and 6.

