. 2021 May 18;10:e60108. doi: 10.7554/eLife.60108

Figure 3. Glial cell diversity and dynamics.

(a) Highlights the position of glial cells in UMAP space relative to the whole dataset. (b) Cluster analysis in glia. (c) Expression of markers relative to cell cluster, developmental stage and pseudotime. (d) Pseudotime of the developmental trajectory in glia. (e) The relative contributions of cell clusters to the composition of glia at the indicated developmental stages. Note that Schwann cells and myelinating cell markers increase with the developmental time.

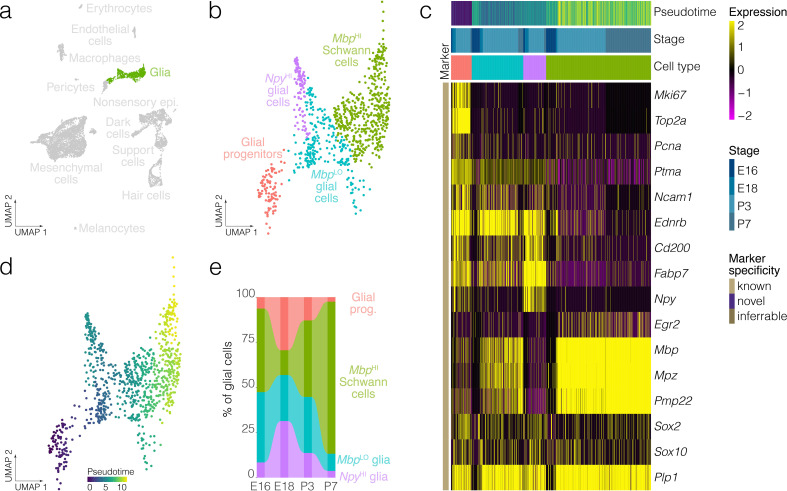
Figure 3.

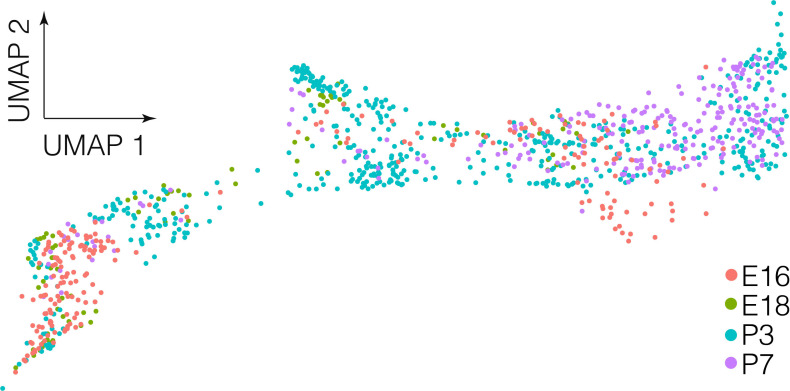
Figure 3—figure supplement 1. Developmental stage relative to UMAP in crista glial cells.

Figure 3—figure supplement 1.

Glial cells in the whole dataset shown in UMAP with color-coding by developmental stage.
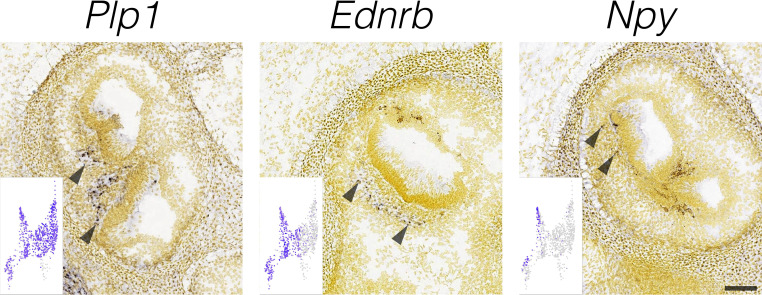
Figure 3—figure supplement 2. Localization of glial cell markers.

Figure 3—figure supplement 2.

RNA in situ hybridization data from the Allen Developing Mouse Brain Atlas is shown for cluster-specific markers in E15.5 cristae. Insets show the cluster specificity in UMAP. Arrowheads indicate RNA ISH signal in the approximate localization of the crista nerve fibers. Scale bar = 100 μm.