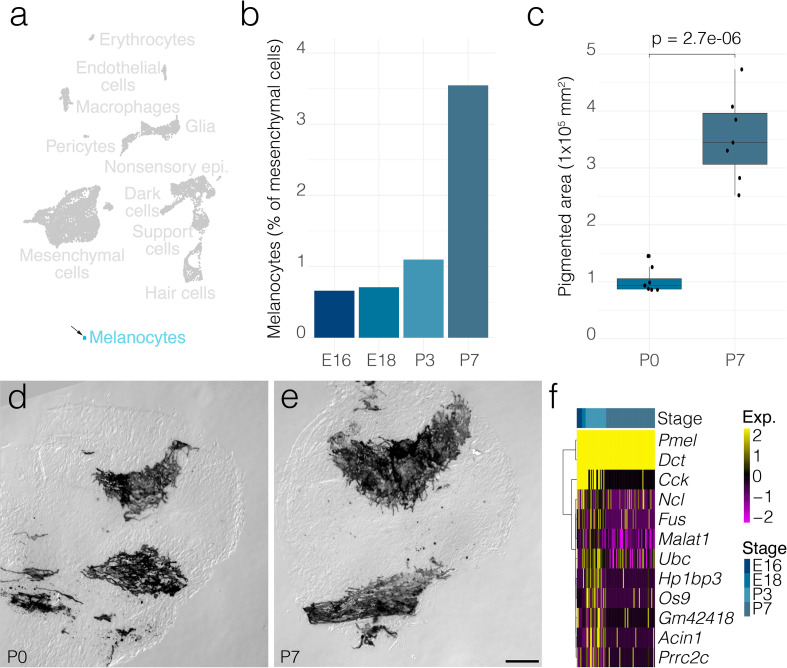
Figure 6. Melanocyte dynamics.
(a) Arrow indicates the cluster of melanocytes in UMAP space relative to the whole dataset. (b) The relative contributions of melanocytes to the composition of the mesenchyme at the indicated developmental stages. (c) The area occupied by pigmented cells quantified from DIC micrographs of whole mount cristae at P0 (n = 7) and P7 (n = 7) as shown in d and e, respectively. (f) Shows differential gene expression in melanocytes at P7 relative to those at P3. Scale bar = 100 μm.

