. 2021 May 18;10:e60108. doi: 10.7554/eLife.60108

Figure 7. Macrophage and vascular cell diversity and dynamics.

(a) Highlights the positions of macrophages and vascular cells in UMAP space relative to the whole dataset. (b) The relative contributions of cell clusters to the composition of the vasculature at the indicated developmental stages. A subset of macrophages is not associated with blood vessels (Figure 5a). (c) Expression of markers relative to macrophage cluster. (d) Relative expression of markers in endothelial cells and pericytes. (e) Cluster analysis in the macrophages. (f) Pseudotime of the macrophage trajectory.

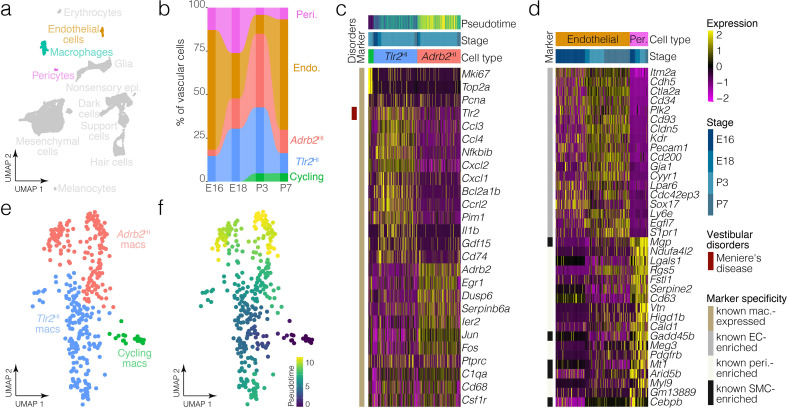
Figure 7.

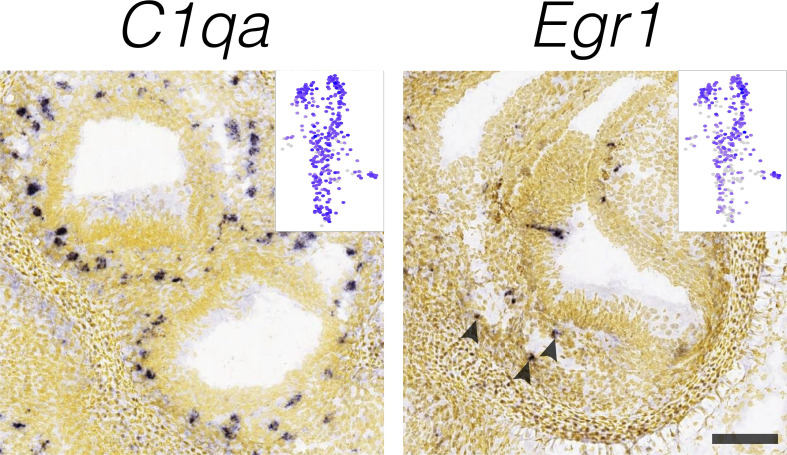
Figure 7—figure supplement 1. Localization of macrophage markers.

Figure 7—figure supplement 1.

RNA in situ hybridization data from the Allen Developing Mouse Brain Atlas is shown for macrophage cluster-specific markers in E15.5 B6 cristae. Insets show the cluster specificity in UMAP. Arrowheads indicate Egr1 RNA ISH signal in a sparse population of mesenchymal cells within the posterior crista. Scale bar = 100 μm.
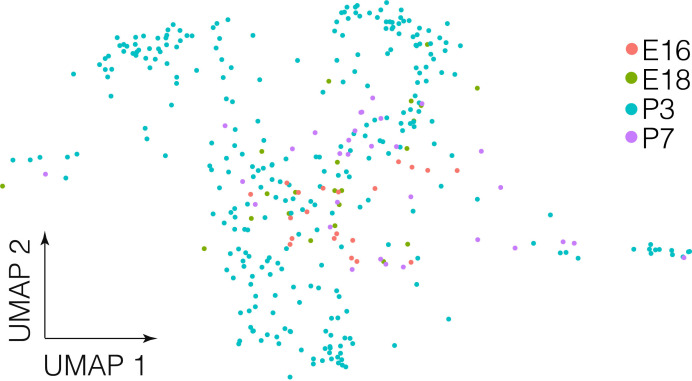
Figure 7—figure supplement 2. Developmental stage relative to UMAP in ampulla macrophages.

Figure 7—figure supplement 2.

Macrophages in the whole dataset shown in UMAP with color-coding by developmental stage.