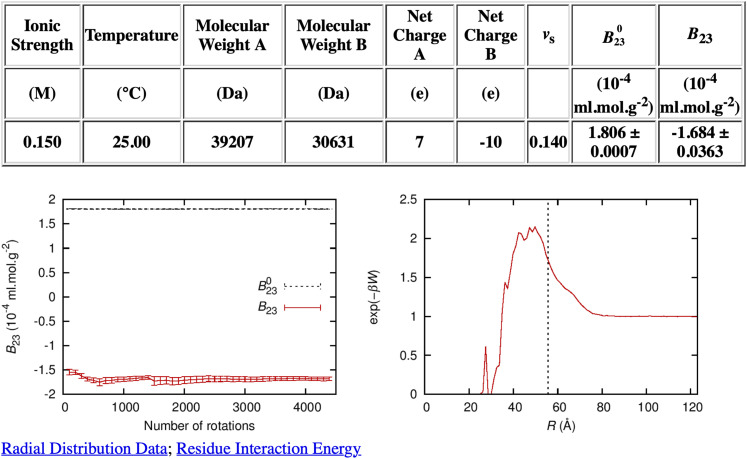
FIG. 2.
Output from the FMAPB23 server for PKAcat(Mg2+) (PDB: 6NO7 E) and RIα (PDB: 6NO7 H; with residues up to residue 104 truncated). Along with the calculated results for B230 and B23 presented in a table, the output includes plots of (left panel) the convergence of B23 as a function of the number of rotations of the probe molecule and (right panel) the radial distribution function. The two molecules are labeled as A and B; A is static, whereas B is rotated many times (as specified by “Number of rotations”) to evaluate the integration over Ω. Error bars represent standard deviations among the different rotations. The radial distribution function is the Boltzmann factor of the potential of mean force along the distance R between the two protein molecules. The vertical dashed line in the radial distribution function plot represents the contact distance of two spheres with the same B230 value as the two protein molecules. Links to the raw data for the radial distribution function and the residue interaction energy (“Radial Distribution Data” and “Residue Interaction Energy”) are also created on the output page.

