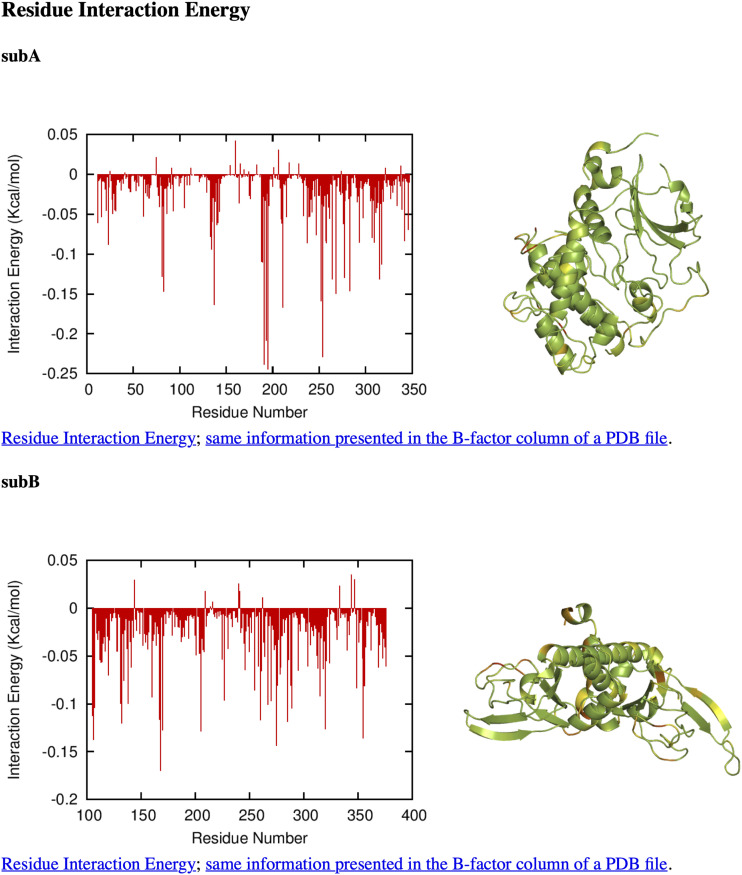
FIG. 3.
Residue interaction energy output from FMAPB23 for PKAcat(Mg2+) (6NO7 E; subA) and cAMP-free RIα (6NO7 H with residues truncated up to residue 104; subB). The results are plotted as a bar graph and also displayed on a structure, with green, yellow, and red showing small, medium, and large contributions, respectively. Links to the raw data (“Residue Interaction Energy” and “same information presented in the B-factor column of a PDB file”) are also created on the output page.

