
Fig. 1. Overall structure of nucleosome-bound cGAS.
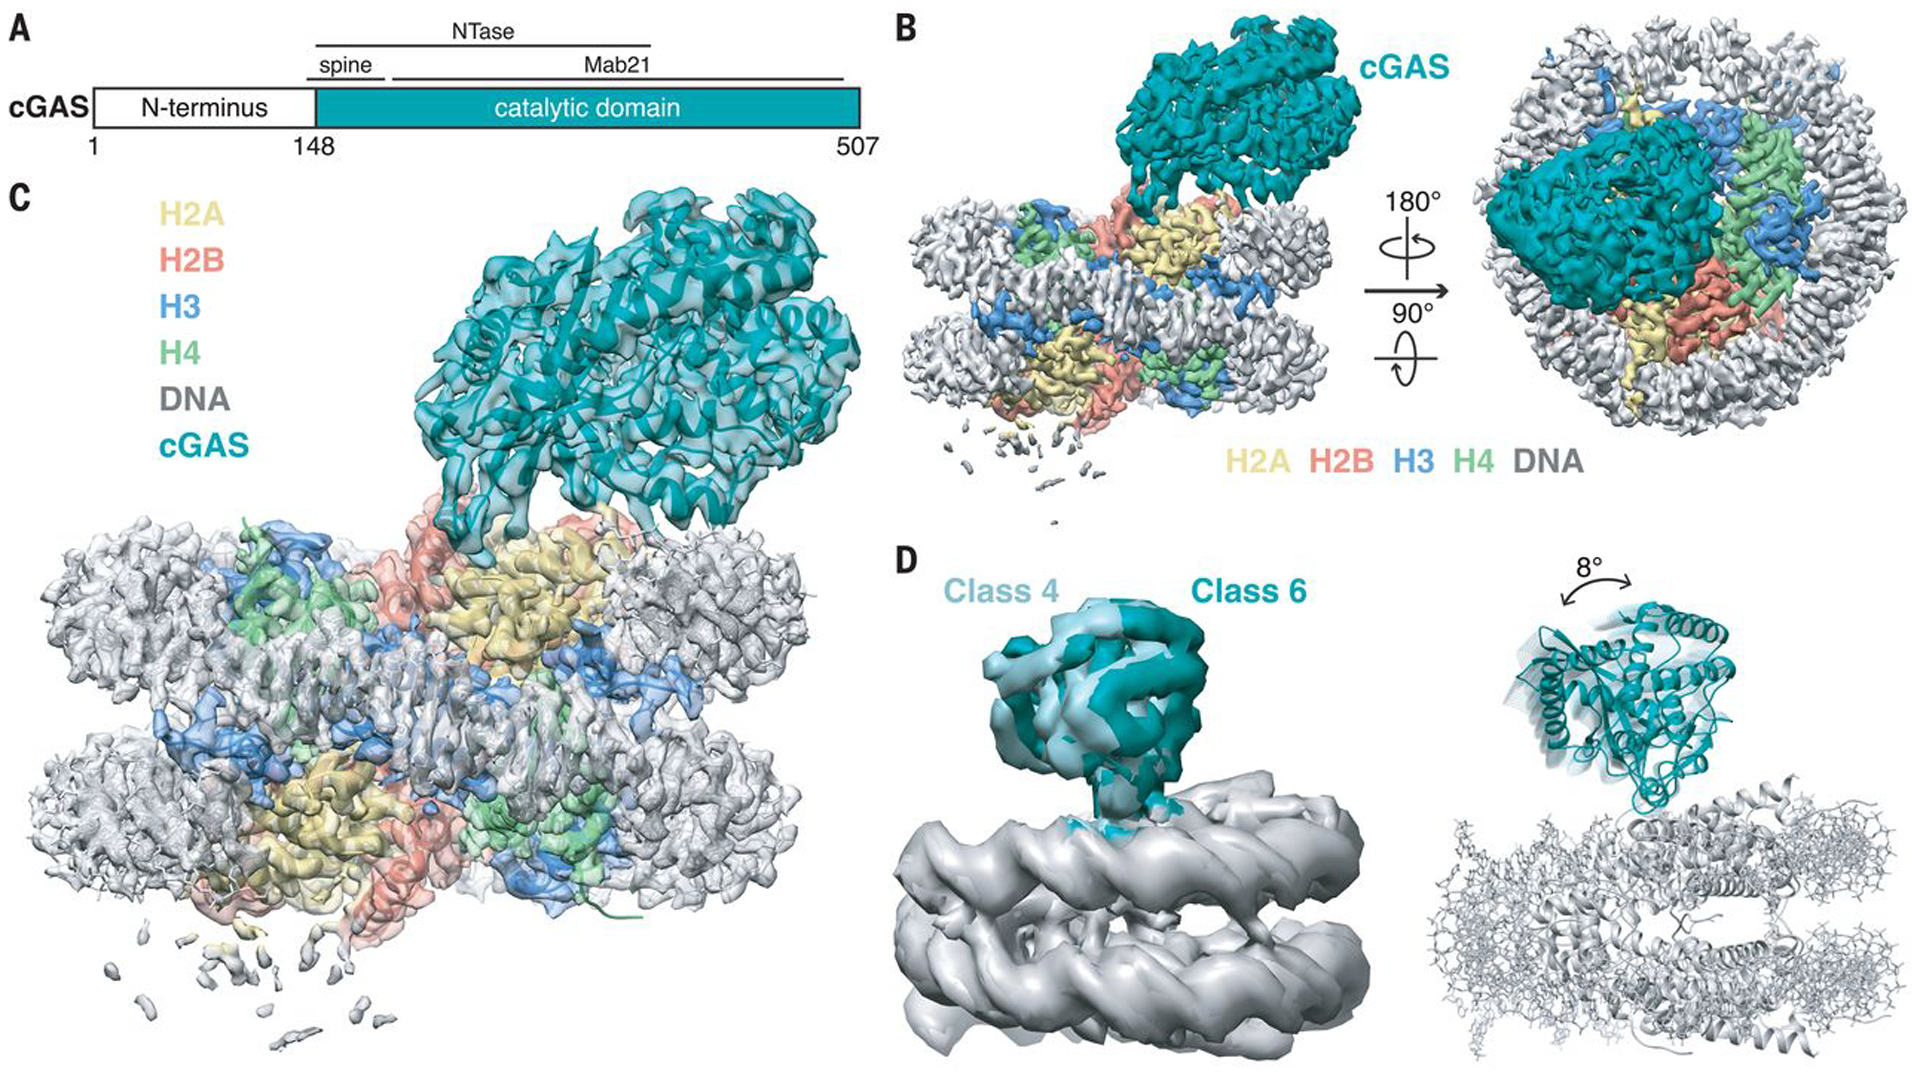
(A) Schematic of the mouse cGAS primary structure colored by domains. (B) Side and top views of the composite cryo-EM density map of cGAS-NCP complex. cGAS, H2A, H2B, H3, H4, and DNA are colored teal, yellow, red, blue, green, and gray, respectively. (C) Transparent composite cryo-EM density map overlaid onto atomic model of cGAS-NCP complex. (D) Overlay of 3D subclasses (left) and cartoon representations that depict the hinge motion of cGAS relative the nucleosome (right) created by morphing between cGAS structures docked into class 4 and class 6 maps.