
Fig. 2. Interactions between cGAS and the nucleosome core particle.
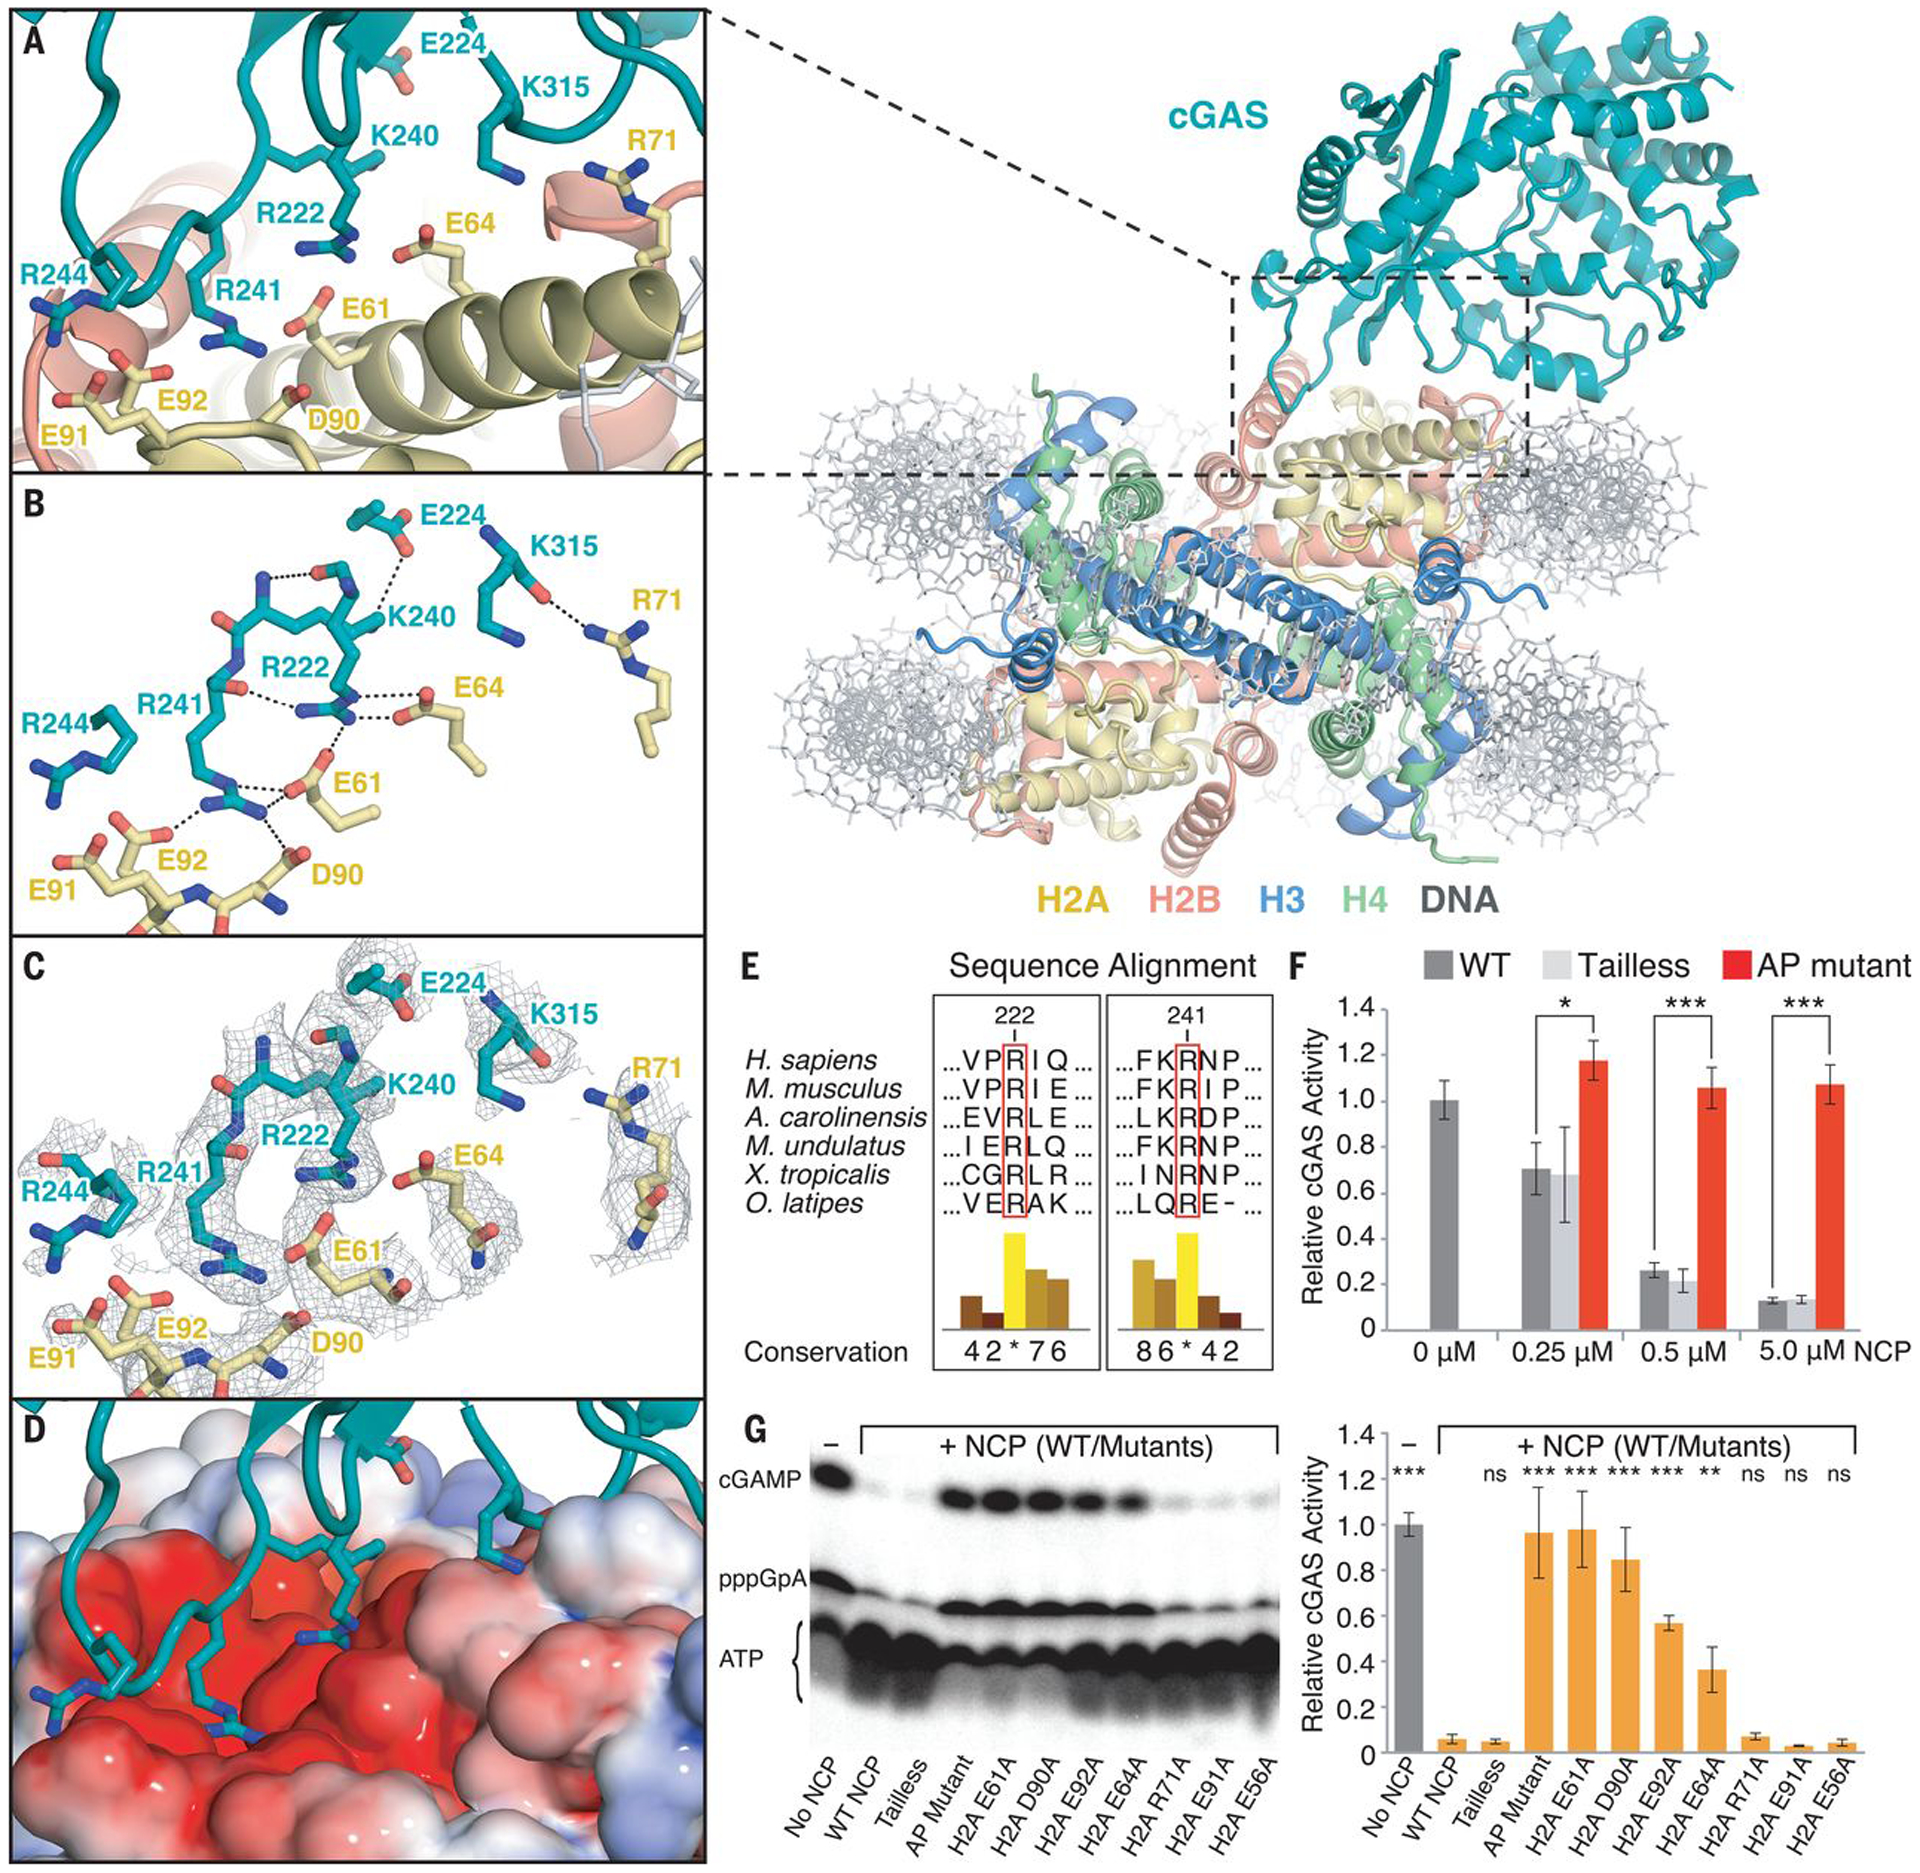
(A) Close-up view of the binding interface of the cGAS-NCP complex. (B) Close-up view of the hydrogen-bond network between cGAS residues (teal) and histone H2A residues (yellow). (C) Close-up view of the binding interface with composite combined focused map overlaid. (D) Identical view of cGAS interacting with the nucleosome acidic patch as highlighted with electrostatic potential surface, where positive is shown in blue and negative is shown in red. (E) Conservation of the arginine anchors, R222 and R241, of cGAS across vertebrates. Numerical and histogram representations of the conservation score are shown, where asterisks denote complete identity conservation (http://www.jalview.org/). (F) Quantification of nucleosome-dependent inhibition of cGAS activity. (G) Quantification of the inhibitory effect of individual nucleosome acidic-patch residues on cGAS activity (0.5 μM cGAS: 5 μM dsDNA) in the presence of 5 μM NCP mutants. ATP, pppGpA, and cGAMP are substrate, intermediate, and product, respectively. Average relative cGAS activities from three replicates are plotted with standard deviations represented as error bars (mean ± SD), where ns, *, ** and *** denote p-values >0.05, <0.05, <0.01 and <0.001, respectively, for statistical differences between WT and mutant NCPs.