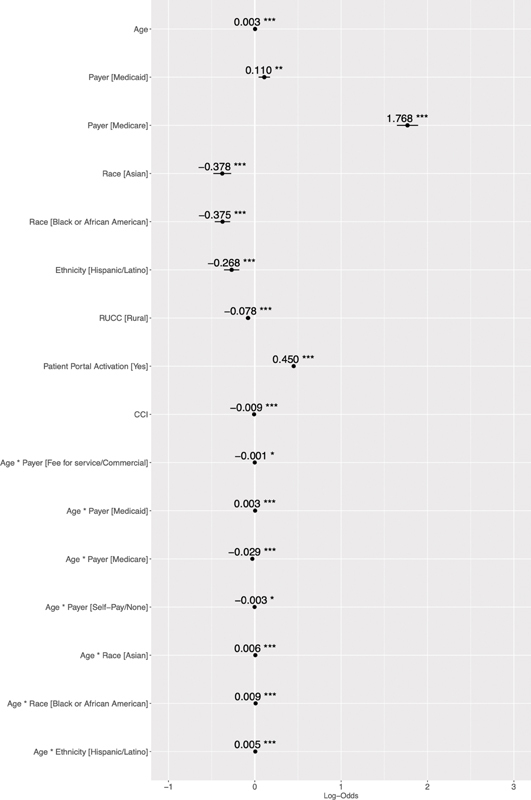
Fig. 3.

The forest plot presents a visualization of the results (logistic regression results for video or audio versus in-person visits). Variables to the right are positively associated with the outcome, and values to the left are negatively associated. The bar represents the 95% confidence interval. Only statistically significant variables are shown in the forest plot; * p < 0.001, ** p < 0.01, *** p < 0.05. CCI, Charlson Comorbidity Index.
