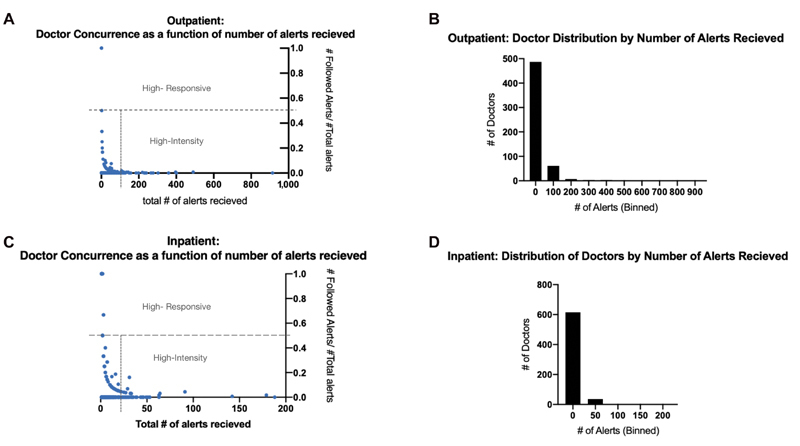
Fig. 3.

( A ) Outpatient: rate of concurrence as a function of number of alerts received. We defined highly responsive providers to be those who concur with the alerts at least 50% of the time, and high-intensity providers as those who are prescribing 1.5 times over the third quartile of prescribers. ( B ) Outpatient: distribution of clinicians by number of non-concurrent (ignored and overridden) alerts. Descriptive statistics for outpatient providers: Q1: 2 alerts/year Q3: 23 alerts/year, UB: 59.5 alerts/ year. In the outpatient setting, 57 (top 10.5%) of providers are statistical outliers accounting for 60% of total not-followed alerts (8,623/14,414). ( C ) Outpatient: rate of concurrence as a function of number of alerts received. We defined highly responsive providers to be those who concur with the alerts at least 50% of the time, and high-intensity providers as those who are prescribing 1.5 times over the third quartile of prescribers. ( D ) Inpatient: distribution of providers by number of non-concurrent (ignored and overridden) alerts. Descriptive statistics for inpatient providers; Q1: 1 alert/year, UB: 18.5 alerts/ year. In the inpatient setting, 62 (top 9.5%) of providers are statistical outliers accounting for 50% of total not-followed alerts.
