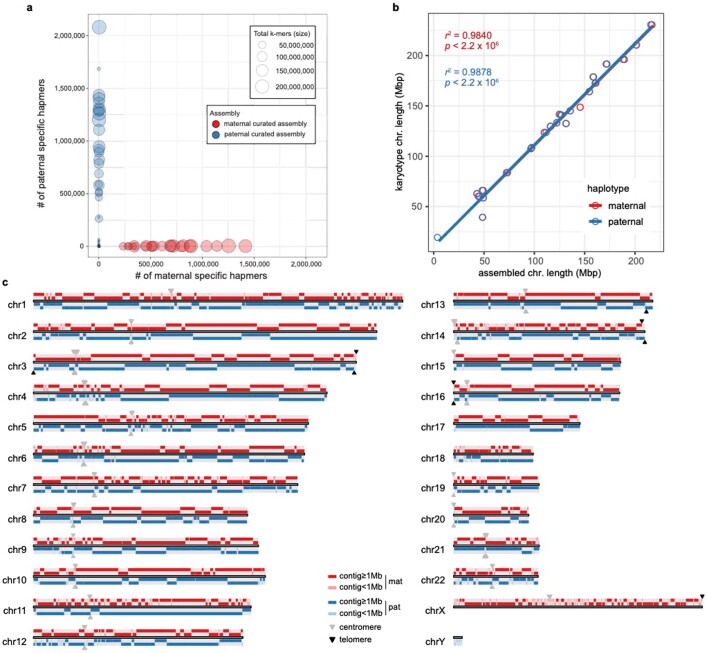
Extended Data Fig. 2. Trio-based diploid genome assembly.
a, Hapmer (haplotype-specific k-mer) blob plot of the curated marmoset assemblies. Red, maternal haplotype; blue, paternal haplotype. The size of each blob indicates the total number of k-mers counted in an individual scaffold and the position of each blob is plotted according to the number of contained maternal and paternal hapmers. We see that maternal and paternal hapmers are highly phased, with some slight representation of paternal hapmers in several maternal scaffolds (those that do not lie directly on the x axis). We can also see a higher representation of paternal hapmers identified within scaffolds of the paternal assembly than maternal hapmers identified in scaffolds of the maternal assembly. b, Correlation between the assembled chromosome sizes and the chromosome lengths estimated by karyotype image data. A total of 23 chromosomes are plotted and the coefficient of determination is calculated for each assembly. c, Schematic plot mapping the assembled maternal and paternal assigned contigs onto marmoset assembled chromosomes. Top, maternal alleles; bottom, paternal alleles. Contig sizes, centromeres and telomeres are indicated.

