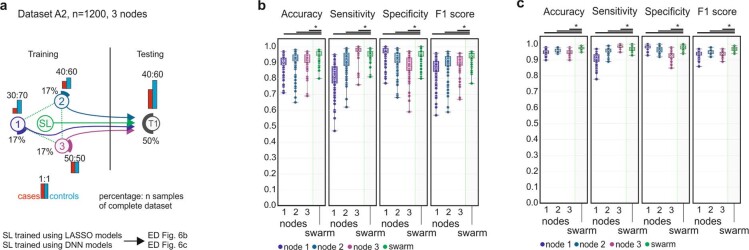
Extended Data Fig. 6. Comparison of LASSO and neural networks.
a, Scenario for training different models in the Swarm. b, Evaluation of a LASSO model for accuracy, sensitivity, specificity and F1 score over 100 permutations. c, Evaluation of a Neural Network model for accuracy, sensitivity, specificity and F1 score over 100 permutations. b, c, Box plots show performance of all permutations performed for the training nodes individually as well as the results obtained by SL. All samples are biological replicates. Centre dot, mean; box limits, 1st and 3rd quartiles; whiskers, minimum and maximum values. Performance measures are defined for the independent fourth node used for testing only. Statistical differences between results derived by SL and all individual nodes including all permutations performed were calculated with one-sided Wilcoxon signed rank test with continuity correction; *P < 0.05, exact P values listed in Supplementary Table 5.

