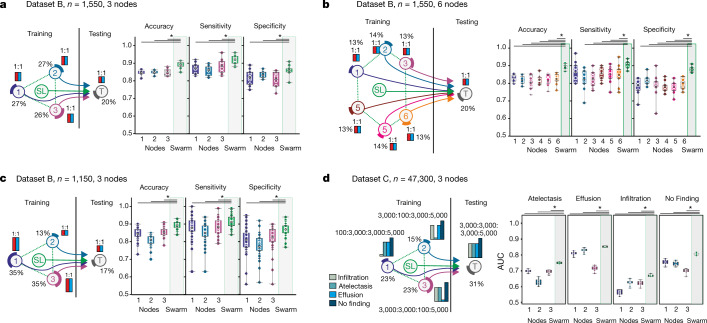
Fig. 3. Swarm Learning to identify patients with TB or lung pathologies.
a–c, Scenarios for the prediction of TB with experimental setup as in Fig. 2a. a, Scenario with even number of cases at each node; 10 permutations. b, Scenario similar to a but with six training nodes; 10 permutations. c, Scenario in which the training nodes have evenly distributed numbers of cases and controls at each training node, but node 2 has fewer samples; 50 permutations. d, Scenario for multilabel prediction of dataset C with uneven distribution of diseases at nodes; 10 permutations. a–d, Box plots show accuracy of all permutations for the training nodes individually and for SL. All samples are biological replicates. Centre dot, mean; box limits, 1st and 3rd quartiles; whiskers, minimum and maximum values. Accuracy is defined for the independent fourth node used for testing only. Statistical differences between results derived by SL and all individual nodes including all permutations performed were calculated with one-sided Wilcoxon signed rank test with continuity correction; *P < 0.05, exact P values listed in Supplementary Table 5.

