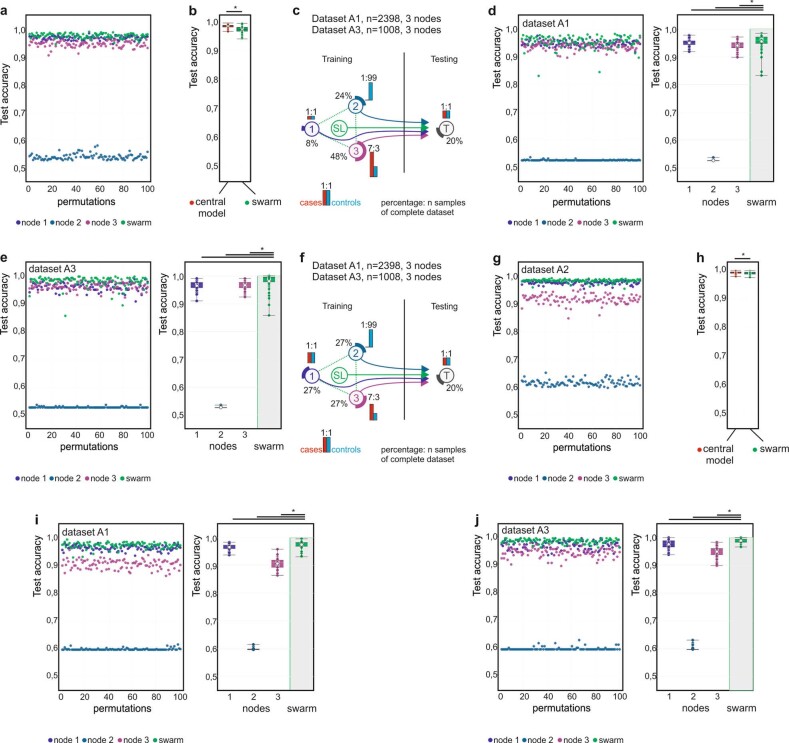
Extended Data Fig. 2. Scenario corresponding to Fig. 2b, c in datasets A1 and A3.
Main settings and representation of schema and data visualization as described in Fig. 2a. a, Evaluation of test accuracy for 100 permutations of the scenario shown in Fig. 2b. b, Evaluation of SL versus central model for the scenario shown in Fig. 2b for 100 permutations. c, Scenario with different prevalences of AML and numbers of samples at each training node. The test dataset has an even distribution. d, Evaluation of test accuracy for 100 permutations of dataset A1 per node and SL. e, Evaluation using dataset A3 for 100 permutations. f, Scenario with similar training set sizes per node but decreasing prevalence. The test dataset ratio is 1:1. g, Evaluation of test accuracy for 100 permutations of the scenario shown in Fig. 2c. h, Evaluation of SL versus central model of the scenario shown in Fig. 2c for 100 permutations. i, Evaluation of test accuracy over 100 permutations for dataset A1 with the scenario shown in f. j, Evaluation of test accuracy over 100 permutations for dataset A3 with the scenario shown in f. b, d, e, h–j, Box plots show representation of accuracy of 100 permutations performed for the 3 training nodes individually as well as the results obtained by SL. All samples are biological replicates. Centre dot, mean; box limits, 1st and 3rd quartiles; whiskers, minimum and maximum values. Accuracy is defined for the independent fourth node used for testing only. Statistical differences between results derived by SL and all individual nodes including all permutations performed were calculated with one-sided Wilcoxon signed rank test with continuity correction; *P < 0.05, exact P values listed in Supplementary Table 5.

