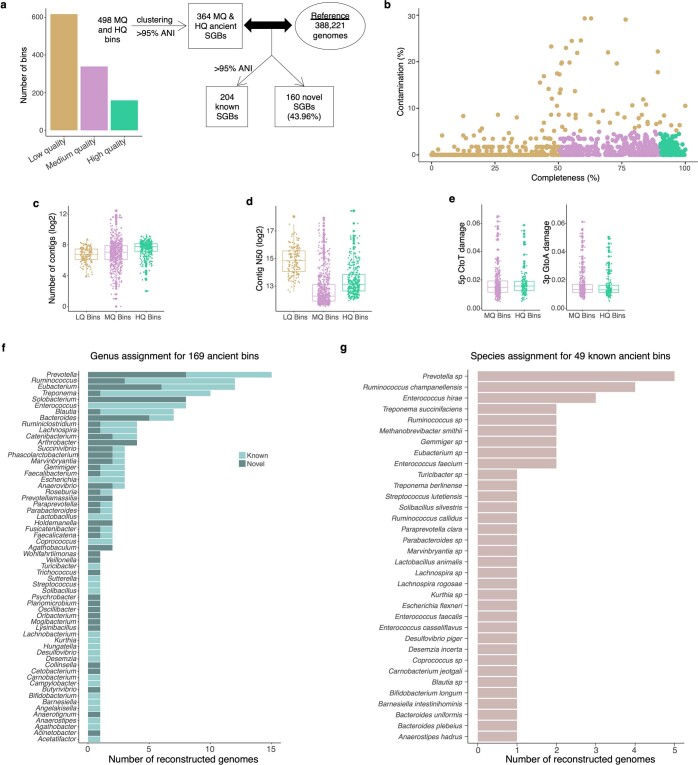
Extended Data Fig. 7. De novo genome reconstruction from palaeofaeces recovers 498 medium- and high-quality microbial genomes, 44% of which are novel SGBs.
Related to Fig. 2. a–d, CheckM79 quality estimation of all 498 de novo reconstructed microbial genomes (low-quality bins, n = 617; medium-quality bins, n = 339; high-quality bins, n = 159). Genomes were classified as low quality (completeness ≤ 50% or contamination > 5%), medium quality (90% ≥ completeness > 50% and contamination < 5%) or high quality (completeness > 90% and contamination < 5%). a, Number of bins that belong to each of the quality categories and classification of novel SGBs. b, Contamination and completeness distribution for the reconstructed genomes. c, Distribution of the number of contigs for each of the quality categories. d, Distribution of contig N50 values for each of the quality categories. e, Damage levels, specifically C-to-T substitutions at the 5′ end and G-to-A substitutions at the 3′ end of the reads, for each bin as estimated by DamageProfiler88 (medium-quality bins, n = 339; high-quality bins, n = 159). f, GTDB-Tk23 genus estimation for members of both the novel and known SGBs. g, GTDB-Tk23 species assignment for members of the known SGBs. In c–e, data are presented as box plots (middle line, median; lower hinge, first quartile; upper hinge, third quartile; upper whisker extends from the hinge to the largest value no further than 1.5× the interquartile range from the hinge; lower whisker extends from the hinge to the smallest value at most 1.5× the interquartile range from the hinge; data beyond the end of the whiskers are individually plotted outlying points).

