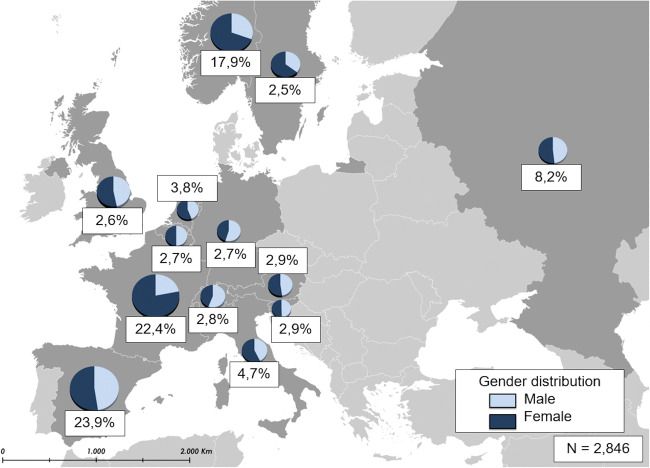
Fig. 2.
European sample distribution of patients for each EMAS country stratified by gender (N = 2846). The depicted European map represents the contribution of each EMAS participating country to the total sample size of 2846 participants. France provided one of the largest proportions (22.4%), followed by Spain (23.9%), Norway (17.9%), and the Russian Federation (8.2%). Italy provides 4.7%, the Netherlands 3.8%, Austria and Slovenia 2.9%, Switzerland 2.8%, Belgium and Germany 2.7%, the UK 2.6% and Sweden 2.5%. Gender distribution, as shown in the individual pie charts, is similar among countries with the exception of France, Norway, and Sweden (with a majority of female participants). The proportion of males was only slightly larger among the Swiss and German samples. Percentages represent each country’s contribution to the total sample. Pie charts represent the gender distribution of each country.

