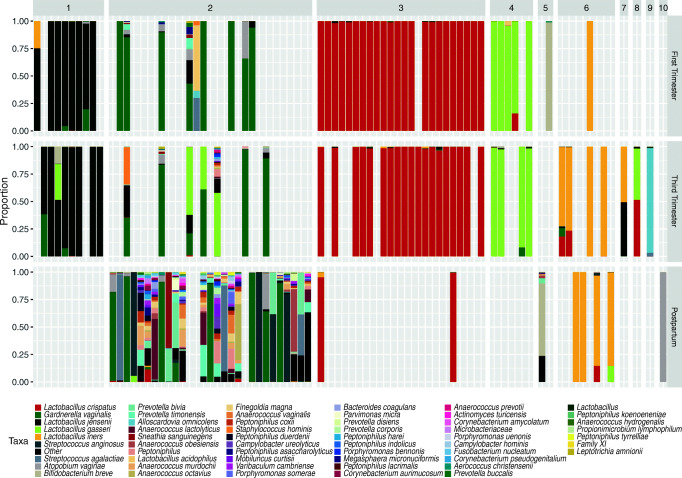
Fig. 1.
Relative proportions of bacteria in the vaginal communities of 48 pregnant women separated by stage and cluster. The stacked bars represent the proportions of bacterial taxa within one sample. Bars are separated by the pregnancy stage in which the sample was collected (right heading), and the cluster the sample was grouped into (top heading). Taxa colors are indicated in the legend below the figure. “Other” represents the sum of all bacterial taxa that were not present at 1% or more in at least two women

