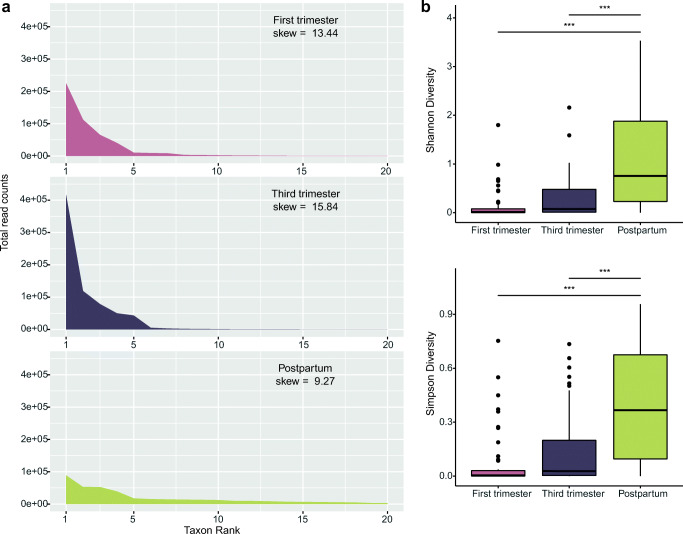
Fig. 2.
Rank abundance and ⍺-diversity profiles of samples collected during the first trimester, third trimester, and postpartum. Panel a shows the counts of the top-ranked taxa among first trimester, third trimester, and postpartum samples. Panel b shows the distribution of Shannon and Simpson diversity measures for each stage. The thick band within the box represents the median for the data, and the lower and upper boxes represent the 25th and 75th quartiles, respectively. The upper and lower whiskers represent the 95% confidence interval for the median. Individual dots above represent outliers that were not removed. Statistical significance is indicated above the lines (“***” = p < 0.001)

