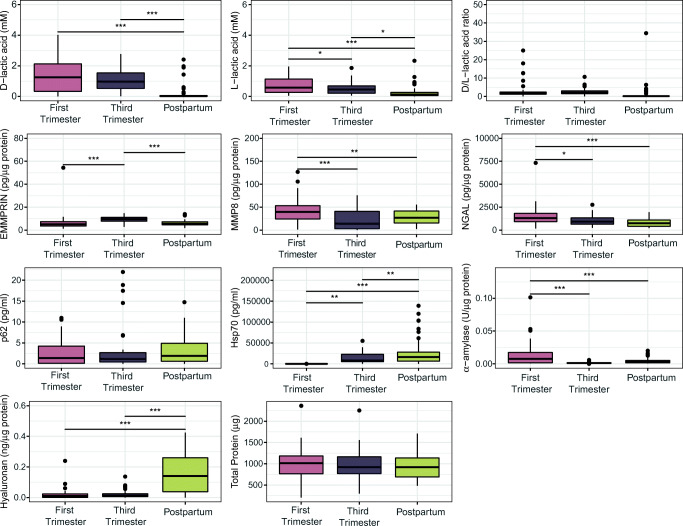
Fig. 4.
Boxplots showing the concentrations of vaginal biomarkers grouped by stage in pregnancy. The thick band within the box represents the median for the data, and the lower and upper boxes represent the 25th and 75th quartiles, respectively. The upper and lower whiskers represent the 95% confidence interval for the median. Individual dots above represent outliers that were not removed. Statistical significance is indicated above the lines as follows: “*”, p < 0.05; “**”, p < 0.01; “***” = p < 0.001

