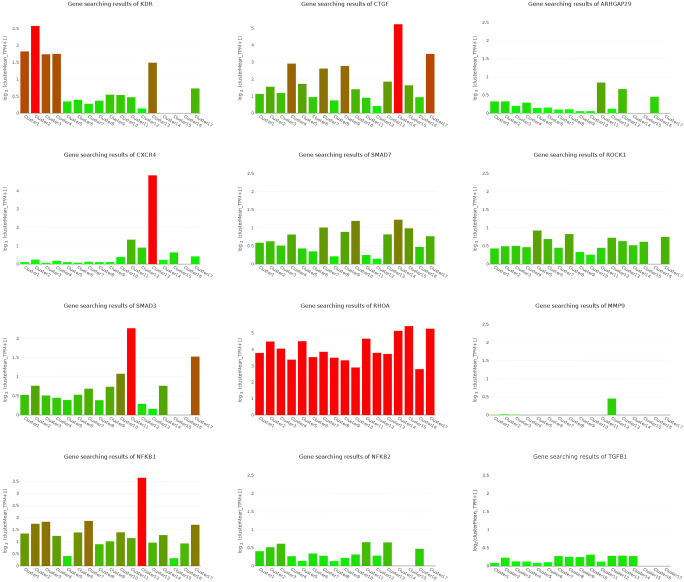
Fig. 4.
Uterine cellular expression profile related to IUA pathogenesis. cluster1: endothelial cell_COL15A1 high; cluster2: endothelial cell_ESM1 high; cluster3: endothelial cell_IL6 high; cluster4: endothelial cell_SOCS3 high; cluster5: smooth muscle cell_MYL9 high; cluster6: stromal cell_RGS5 high; cluster7: fibroblast; cluster8: smooth muscle cell_PDK4 high; cluster9: smooth muscle cell_ACTG2 high; cluster10: stromal cell_ERRFI1 high; cluster11: endometrial cell; cluster12: M1 macrophage; cluster13: T cell; cluster14: endothelial cell in EMT; cluster15: endothelial cell_FABP4 high; cluster16: mast cell; cluster17: luminal epithelium

