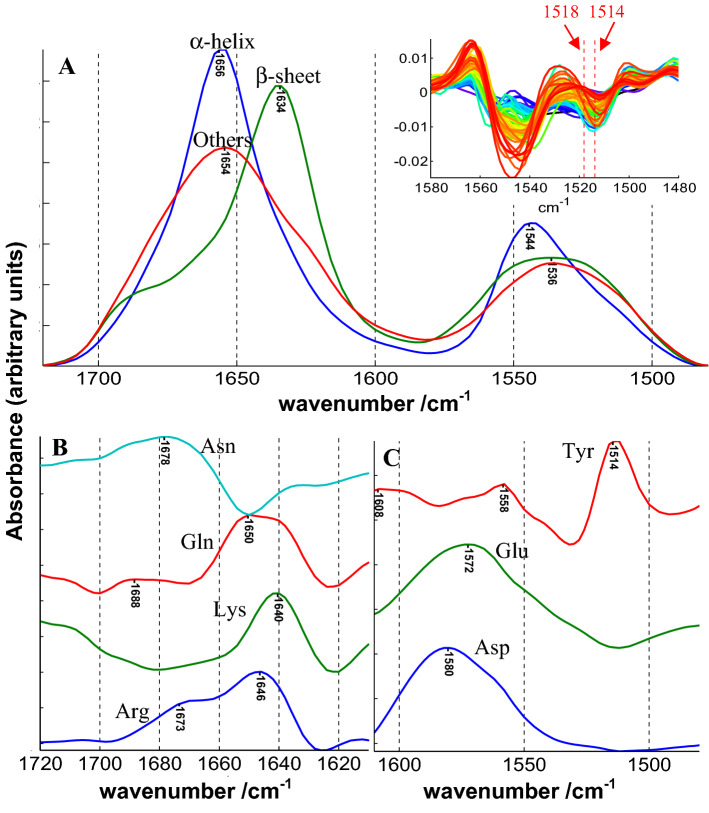
Fig. 1.
Shape of the different components contributing to the FTIR spectrum of cSP92 proteins in the amide I–amide II spectral region. The C matrix contains for each protein the concentration in dH, dE, dOthers, Asp, Glu, Tyr, Gln, Asn, Arg and Lys. Other amino acids absorb here but the intensity of their contribution is minor. a Shape of the α-helix (dH), β-sheet (dE) and the “Others” structures (dOthers). b Shape of the amino acid whose main contribution is found the amide I region of the spectrum. c shape of the contribution of amino acids whose main contribution is found in the amide II region of the spectrum. The inset in part A. of the figure reports the second derivative between 1580 and 1480 cm−1 of the protein spectra of cSP92 and the two red vertical lines report the observed tyrosine ring vibration at 1514 and the expected value for free Tyr amino acid at 1518 cm−1

