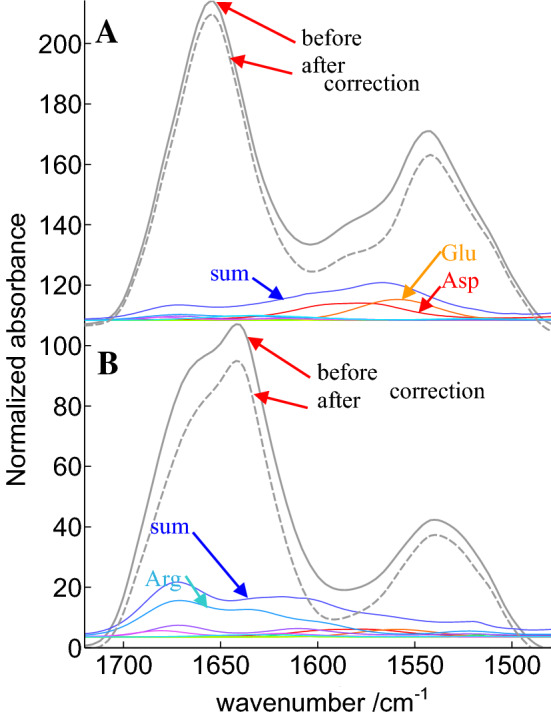
Fig. 3.

Illustration of the subtraction of amino acid side chain contributions for a calmodulin and b endo-1,4-beta-xylanase. The gray lines show the recorded spectra (plain line) and the corrected spectra (dashed line). The corrected spectra are obtained after subtraction of the sum of the amino acid contributions (blue line). The individual contributions of the side chains are shown in color. The contribution of glutamic and aspartic acids is identified in a for calmodulin and of arginine side chains in b for endo-1,4-beta-xylanase. Absorbance is in arbitrary units and spectra have been offset for the clarity of the figure
