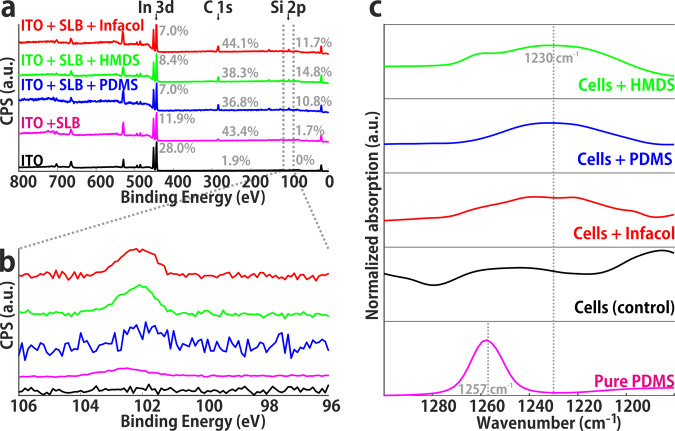
Fig. 2. Spectroscopic analysis by XPS and IR of biological membranes in the form of SLBs and biological cells.
a XPS wide scan showing all atomic species present; carbon content (285 eV) increases after SLB formation and again after silicone introduction. The relative contribution of In 3d (444 eV) decreases after incubation steps. b XPS narrow scan in the Si 2p region, showing increase after silicone introduction. The presence of a trace amount of Si 2p in DOPC supported lipid bilayers (magenta) indicates a minor impurity of the chemicals. c Si-C region in IR spectra obtained from pure PDMS (pink) and cells incubated with various organosilicon compounds (green, HMDS; blue, PDMS; red, Infacol; black, negative control). Incubated cells show a shift in a peak (~1250 cm−1 → ~1230 cm−1) compared to negative control cells.

