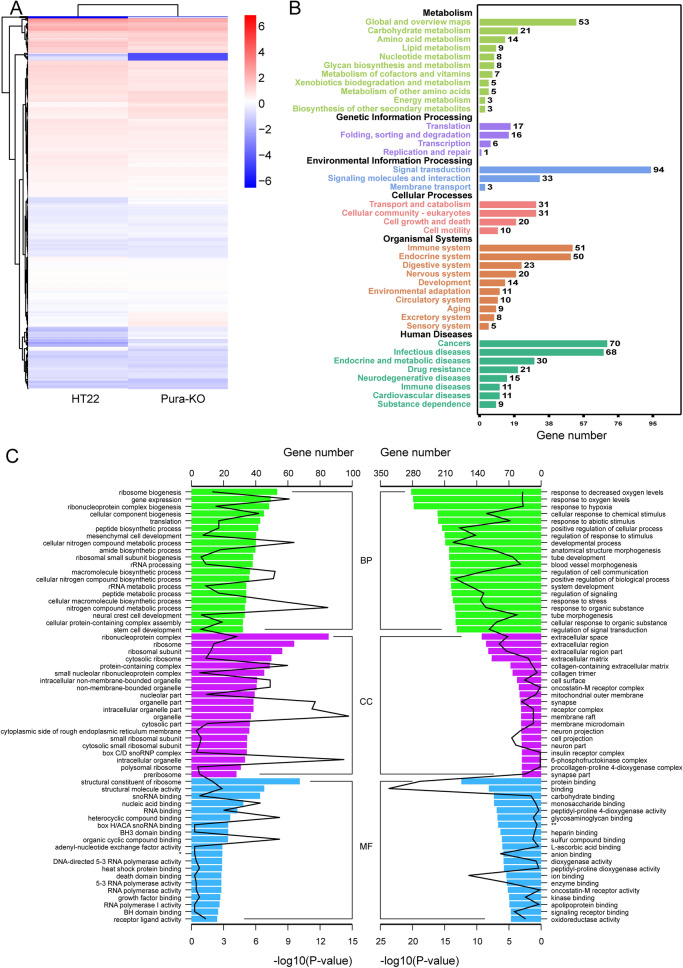
Figure 1.
Differential gene enrichment analysis. (A) The difference between the differential genes in the HT22 group and the Purɑ-KO group is shown in the form of a heat map. (B) Histogram results of KEGG enrichment analysis of differential genes. The abscissa is the number of genes and the ordinate is the enrichment result. (C) GO enrichment of differential genes. The left aspect is the result of up-regulated gene enrichment and the right represents down-regulation. *RNA polymerase II sequence-specific DNA-binding transcription factor binding. **oxidoreductase activity, acting on paired donors, with incorporation or reduction of molecular oxygen, 2-oxoglutrate as one donor, and incorporation of one atom each of oxygen into both donors.

