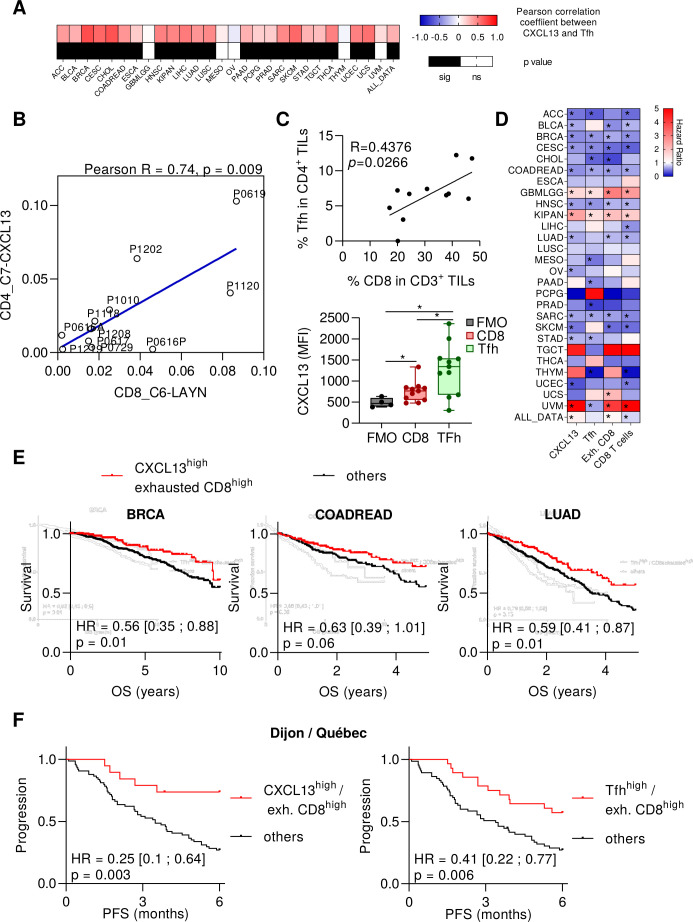
Figure 6.
Human Tfh cell transcriptome is correlated with CXCL13 expression, exhausted CD8+ T cell transcriptome and cancer patients’ prognosis. (A) Heat MAP showing the Pearson correlation coefficients between exhausted CD8+ and Tfh for each type of cancer provided by the TCGA. Black cells represent significant p-values. (B) Dot plot showing correlations between the cell abundance in two clusters measured from single-cell RNAseq data and characterized by Guo et al: 1-CD8+ exhausted T cells and 2-CD4+ T cells with high expression of CXCL13 and harboring Tfh signature. (C) Flow cytometry analyses on cancer patients’ tumor samples. Correlation (Pearson correlation coefficient and linear regression) between the frequency of Tfh cells in CD4+ TILs and CD8+ T cells in CD3+ TILs (upper panel). The median fluorescence intensity (MFI) of CXCL13 was determined for CD8+ TILs and Tfh cells from tumor samples and compared with the fluorescence minus one (FMO) for CXCL13. *P<0.05. (D) Heat MAP showing, for each type of cancer provided by the TCGA, the HR for CXCL13 gene, Tfh, exhausted CD8+ and CD8+ T cell metagenes. Patients were divided into two groups according to low or high expression for each gene or metagene. The low expression group was taken as a reference. Blue cells represent good prognosis and red cells poor prognosis. *Log rank test p<0.05. (E) Kaplan-Meier curves of overall survival (OS) in breast invasive carcinoma (BRCA), colon and rectum adenocarcinoma (COADREAD) and lung adenocarcinoma (LUAD). Red curves represent patients with high expression of exhausted CD8+ metagene and CXCL13 gene and black curves represent patients with at least one metagene with low expression. (F) Kaplan-Meier curves of progression-free survival (PFS) for non-small cell lung cancer patients treated with nivolumab (n=94 patients). Red curves represent patients with high expression of two metagenes among Tfh, CXCL13 and exhausted CD8+ T cells and black curves represent other patients. CXCL13, chemokine (C-X-C motif) Ligand 13; ns, not significant; Tfh, T follicular helper cells;

