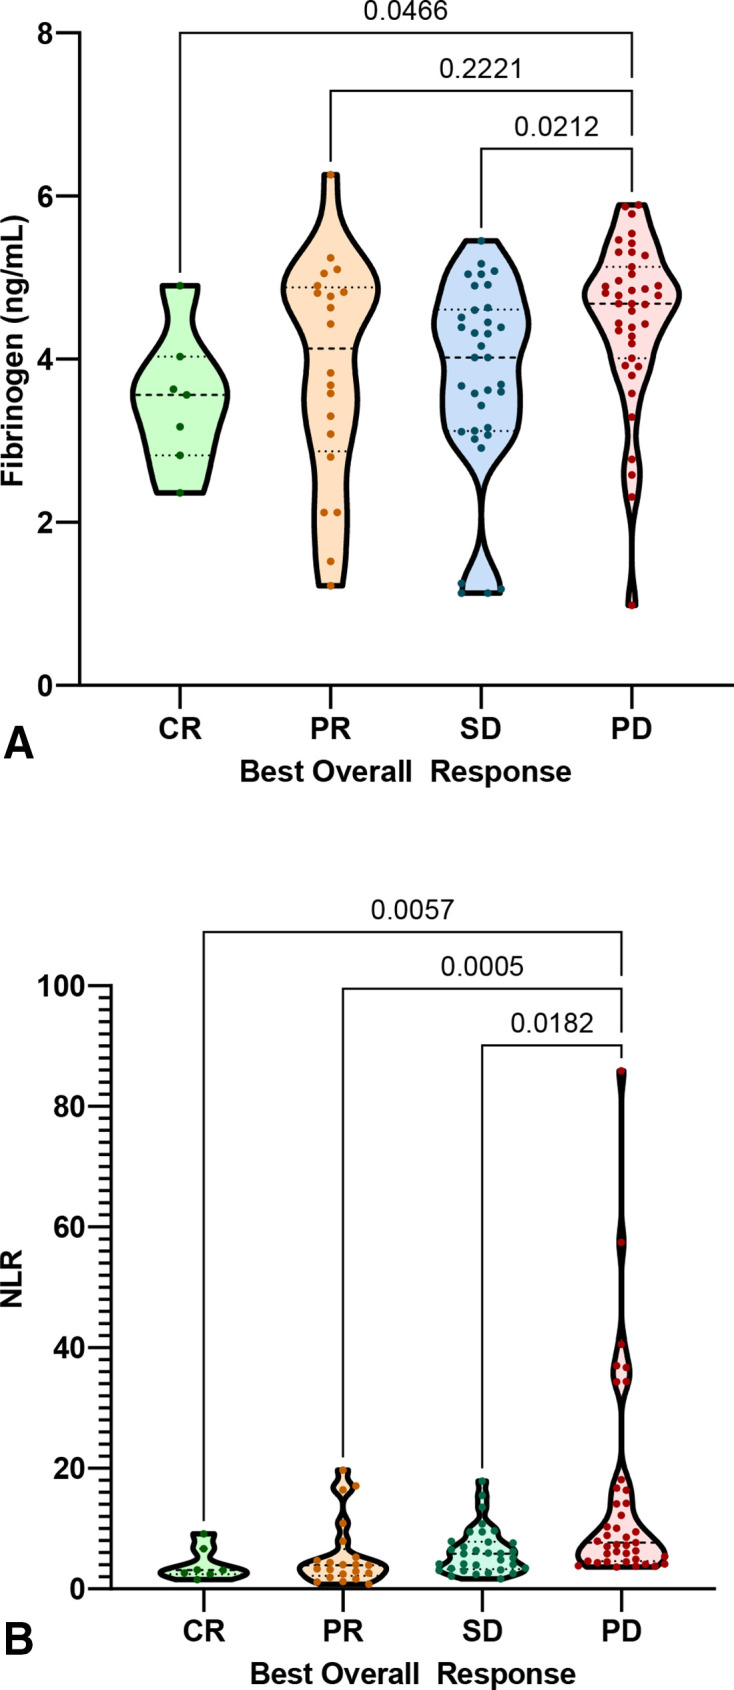
Figure 1.

Violin plot of BOR by on-treatment fibrinogen and on-treatment NLR (Kruskal-Wallis and Dunn’s corrected p values for multiple comparisons are shown). (A) On-treatment fibrinogen and BOR. (B) On-treatment NLR and BOR. BOR, best overall response; CR, complete response; NLR, neutrophil-to-lymphocyte ratio; PD, prograssive disease; PR, partial response; SD, stable disease.
