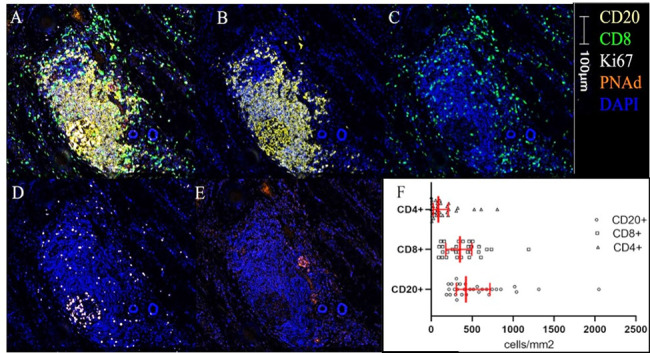
Figure 1.

TLS image and immune cell densities. A representative multiplex image of a TLS is shown in (A–E) colors and scare bar are indicated. (A) Five color mIFH staining, (B) CD20+ B-cell aggregate, (C) CD8+ T-cell aggregate, (D) Ki67+ cells, (E) PNAd+ vasculature, (F) histogram of median densities within TLS. IQRs are shown in red bars. Kruskal-Wallis p<0.01. mIFH, multiplex immunofluorescence; PNAd, peripheral node addressin; TLS, tertiary lymphoid structures.
