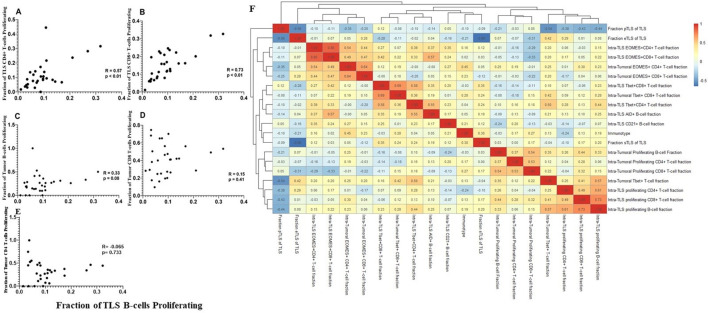
Figure 3.
T cell proliferation at TLS sites is correlated with B cell proliferation. Correlation graphs comparing the relationship between the fraction of proliferating B cells at the TLS site, to the fraction of proliferating CD4+ (A) or CD8 +T cells (C) at the TLS site, and to the fraction of proliferating intratumoral B (B), CD8+ cell (D) or CD4+ (E) infiltrates. R, p values calculated by Spearman rank correlation test. (F) Non-hierarchical clustering of correlations between fraction of lymphocytes expressing a given activity marker in TLS and tumor, as well as fractions of TLS in each maturation state (eTLS, pTLS, sTLS). eTLS, early tertiary lymphoid structure; pTLS, primary follicle-like TLS; sTLS, secondary follicle-like TLS.

