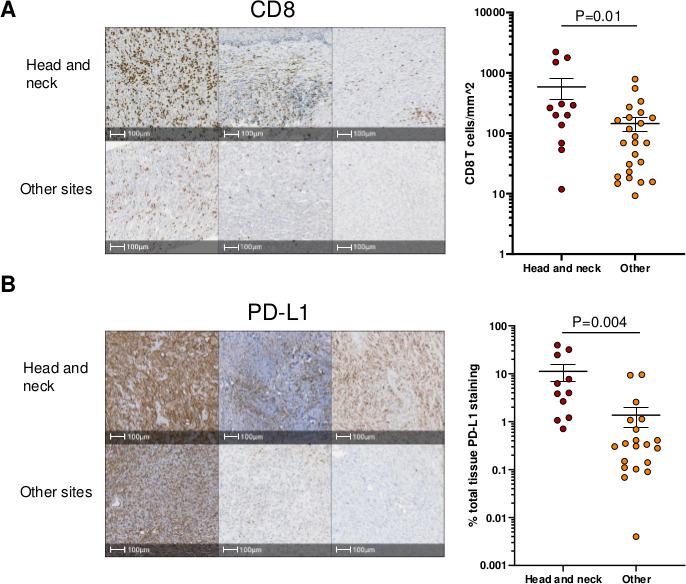
Figure 2.

CD8+ T cell infiltration and PD-L1 expression in UPS tumors of head and neck compared with other sites. (A) Representative images and quantitation of IHC staining of UPS tumors for CD8. The number of CD8+ T cells mm2 of tumor tissue is shown. (B) Representative images and quantifation of IHC staining of ups tumors for PD-L1. Per cent PD-L1 expression of tumor tissue is shown. Ι bars show the SE. P values were calculated using a two-tailed t-test. UPS, undifferentiated pleomorphic sarcoma; IHC, immunohistochemistry.
