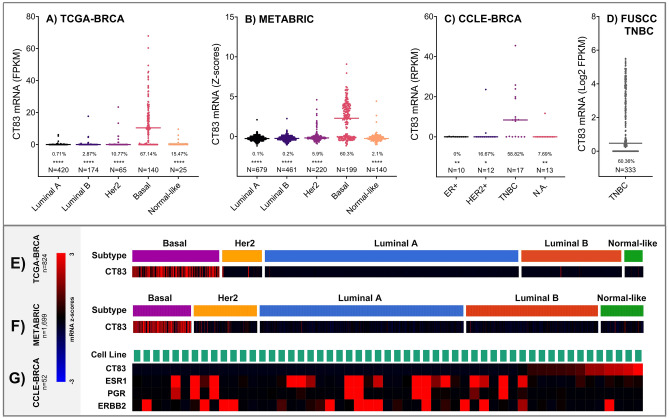
Figure 2.
The expression of CT83 mRNA in breast cancer. The expression of CT83 mRNA in breast cancer tissues of different subtypes according to data from the TCGA-BRCA (A,E) and METABRIC (B,F) dataset. The expression of CT83 mRNA in TNBC tissues according to data from the FUSCC-TNBC dataset (D). The expression of CT83 mRNA in breast cancer cell lines based on data from the CCLE-BRCA dataset (C,G). The expression of ESR1, PGR, and ERBB2 was plotted for distinguishing the subtype of breast cancer cell lines. The median expression of CT83 in each subtype was labeled as dashes. The positive rate of CT83 mRNA was labeled as percentage numbers in A (> 1 FPKM), 2C (> 1 RPKM), and 2D (> 1 Log2 FPKM), while the positive rate of CT83 in B was not presented because the positive expression cutoff cannot be determined based on the METABRIC raw data. Only samples with available both CT83 expression and subtype information were used for plotting. The asterisks in A–C represent the statistical difference (t-test p values) of CT83 expression between the Basal subtype and other subtypes. *, p < 0.05; **, p < 0.01; ***, p < 0.001; ****, p < 0.0001.

