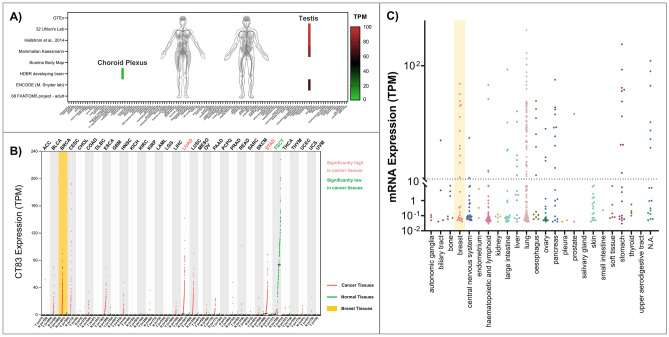
Figure 3.
The expression of CT83 in normal tissues, cancer tissues, and cancer cell lines. (A) The expression of CT83 in normal adult tissues based on 8 RNA-seq datasets obtained from the Expression Atlas. (B) The expression of CT83 in pan-cancer and paired normal tissues based on RNA-seq data from the GEPIA2 database. The abbreviations of involved cancers are available on this webpage (https://gdc.cancer.gov/resources-tcga-users/tcga-code-tables/tcga-study-abbreviations). (C) The expression of CT83 in pan-cancer cell lines based on RNA-seq data from the CCLE dataset.

