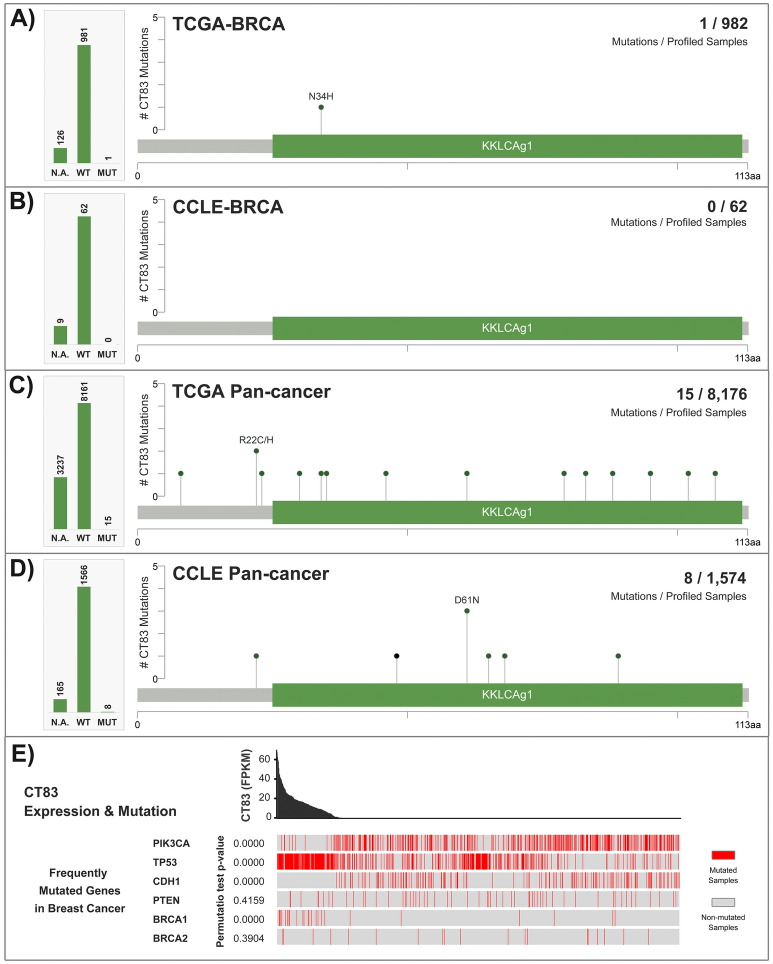
Figure 5.
Mutations of CT83 in cancer. (A) CT83 mutations in breast cancer tissues, (B) breast cancer cell lines, (C) TCGA pan-cancer tissues, and (D) CCLE pan-cancer cell lines. (E) The correlation between CT83 mRNA expression and mutations of key genes in breast cancer based on data from the TCGA-BRCA dataset. CT83 mutation points were labeled in the corresponding regions in the linear schematic diagram of its protein. Permutation test p-values were calculated by comparing CT83 expression in key-gene-mutated samples with key-gene-unmutated samples. N.A., not available; WT, wild type; MUT, mutated.

