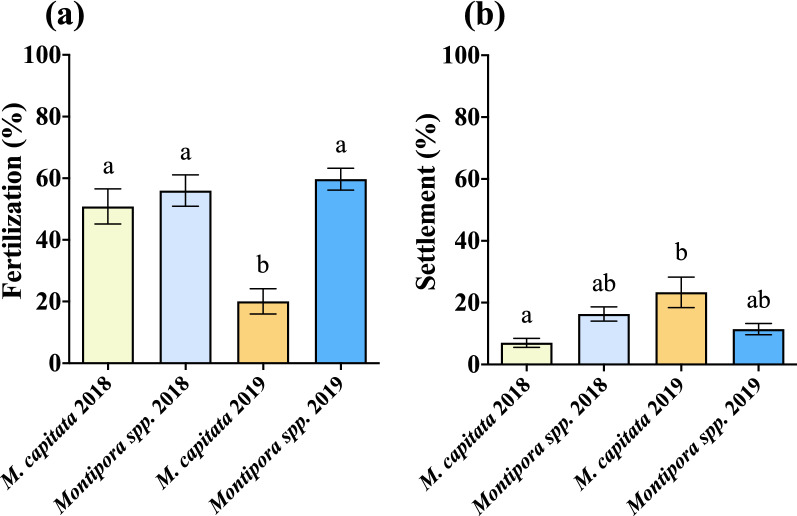
Figure 7.
Percent fertilization and percent settlement. (a) The difference in mean percent fertilization (2018: n = 14 M. capitata, n = 18 Montipora spp.; 2019: n = 19 M. capitata, n = 30 Montipora spp.; see Table S4 in Supplementary Information for two-way ANOVA results). Fertilization success significantly declined in M. capitata from 2018 to 2019 while remaining consistent in Montipora spp. There was no difference in fertilization success between the two in 2018, but there was a noticeable significant difference in 2019. (b) The difference in mean percent settlement between M. capitata and Montipora spp. (2018: n = 36 M. capitata, n = 56 Montipora spp.; 2019: n = 18 M. capitata, n = 55 Montipora spp.; see Table S5 in Supplementary Information for two-way ANOVA results). For M. capitata, there was an increase in settlement percent from 2018 to 2019, but there was no difference between 2018 and 2019 for Montipora spp. Settlement was higher for Montipora spp. than M. capitata in 2018, and this was reversed in 2019. Error bars are SEM, and shared letters above error bars indicate no significant difference as determined by post hoc test of two-way ANOVA. (GraphPad Prism 9 v. 9.0.1; San Diego, CA, USA, www.graphpad.com).

