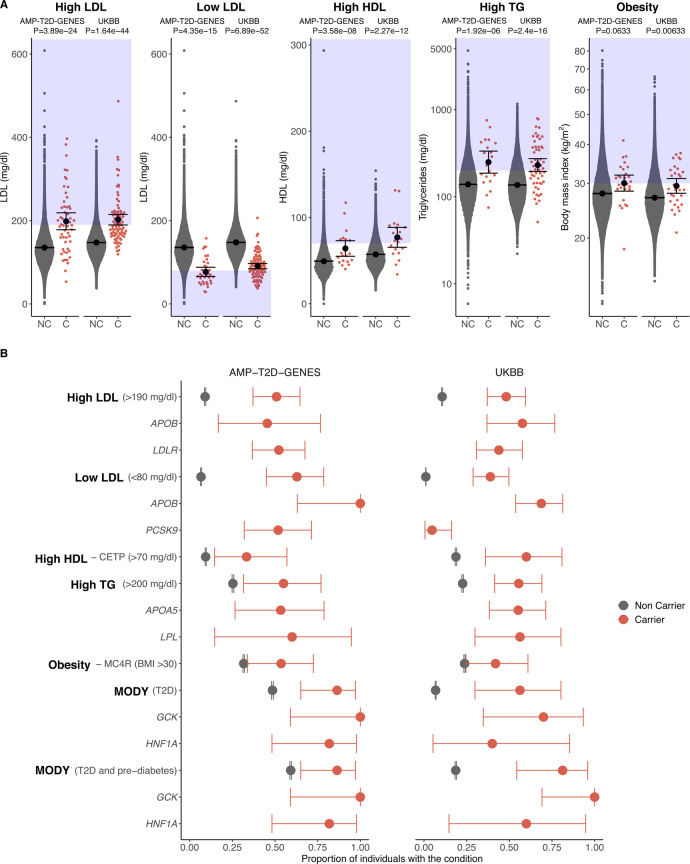
Fig. 3. Phenotype distributions and penetrance estimates of clinically significant variant carriers.
In all plots, clinically significant variant carriers are shown in red and non-carriers are shown in grey. The left panel of each plot shows AMP-T2D-GENES participants (T2D case/control study) and the right panel shows UK Biobank participants (population-based study). See Supplementary Data 3 for individual counts. A Mean and 95% CI are represented by the black circle and black lines, respectively. Relevant lipid levels (mg/dl) or body mass index (kg/m2) are shown for carriers (C) and non-carriers (NC) of clinically significant variants for the five monogenic conditions. The blue boxes indicate the phenotype values that meet a clinical threshold for diagnosis of each of the conditions, and P values were obtained by two-tailed burden analysis in EPACTS (see “Methods”). No adjustment has been made for multiple testing. B Dots are the proportion of individuals that have the condition based on the clinical diagnosis threshold for each condition; for MODY, we show the proportion of individuals meeting T2D as well as T2D and prediabetes criteria (see “Methods”). Error bars reflect 95% CI computed with the Clopper–Pearson method.

