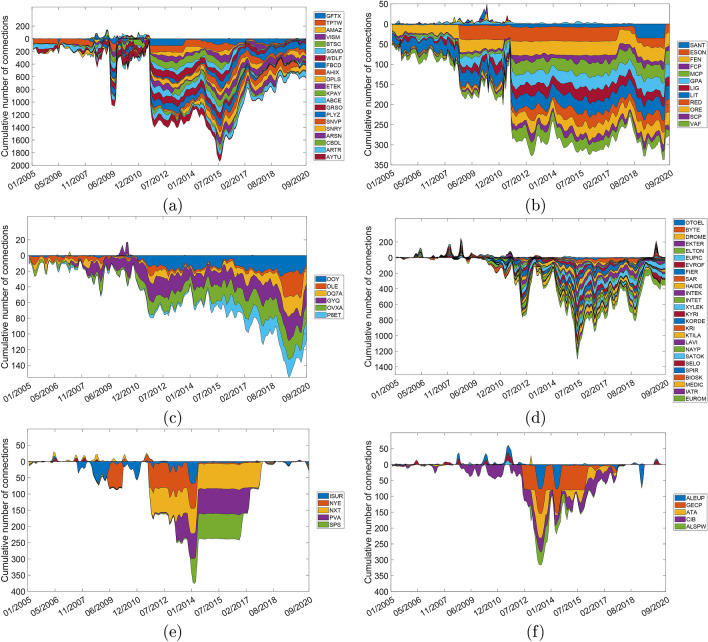
Figure 4.
Positive and negative cumulative centrality degrees. (a) The US. (b) Portugal. (c) Ireland. (d) Greece. (e) Spain. (f) France. Temporal evolution of the cumulative number of connections (degrees) of every stock in the FNC of the six countries where BUT occurred. The cumulative number of positive connections with other stocks are shown over the horizontal line, and the cumulative number of negative connections are shown below that line.

