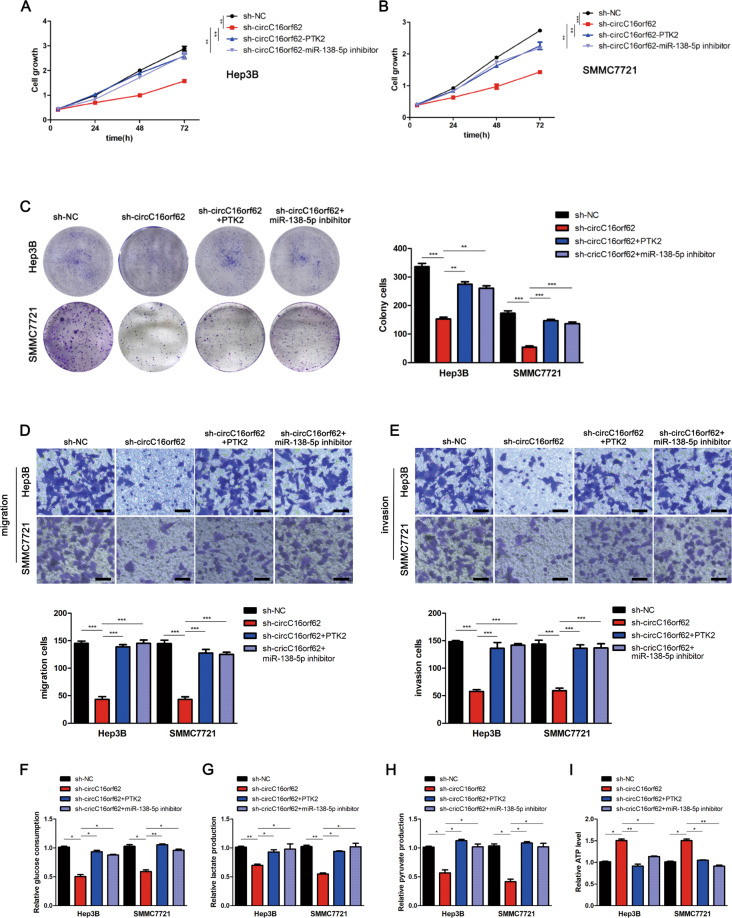
Fig. 6. circC16orf62 knockdown repressed HCC progression via regulating MiR-138-5p/PTK2.
A–C Cell proliferation of four indicated groups was individually tested by CCK8 and plate formation assays. D, E Transwell assay was carried out for detecting cell migration and invasion in different groups, the scale bar represents 50 µm. F–I Glucose consumption (F), lactate production (G), pyruvate production (H), ATP production (I) experiments were conducted to estimate cell motility in three groups. Data are shown as the mean ± standard deviation of three independent experiments. *P < 0.05 was regarded as statistically significant.

